
Datasets
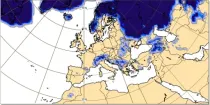
This chart shows probability information regarding minimum temperature 2 m above the ground derived from the ECMWF ensemble (ENS) during the 6 hour period preceding the validity time...
Interval/period: N/A
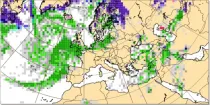
This chart shows probability information regarding precipitation type at the validity time ...
Interval/period: N/A
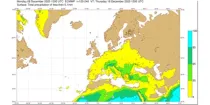
These charts show probabilities of multi-day precipitation accumulation. ...
Interval/period: N/A
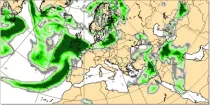
This chart shows probability information derived from the ECMWF ensemble (ENS) regarding large ...
Interval/period: N/A
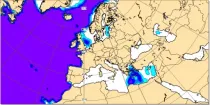
This chart shows probability information regarding significant wave height derived from the ...
Interval/period: N/A
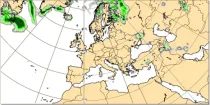
This chart shows probability information regarding snowfall derived from the ECMWF ensemble ...
Interval/period: N/A
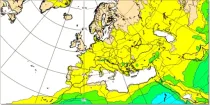
This chart shows probability information regarding total precipitation derived from the ECMWF ...
Interval/period: N/A
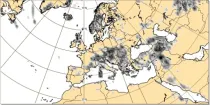
This chart shows probability information regarding visibility near the surface derived from the ...
Interval/period: N/A
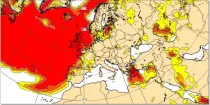
This chart shows probability information regarding the maximum gust at 10 m above the earth's ...
Interval/period: N/A
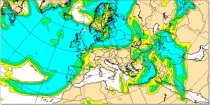
This chart shows probability information regarding 24 hour total precipitation derived from the ...
Interval/period: N/A
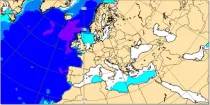
These charts show the probability of various mean periods of ocean waves 10-15 days ahead. The ...
Interval/period: N/A
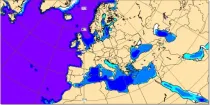
These charts show probability of various heights of significant waves 10-15 days ahead. The ...
Interval/period: N/A
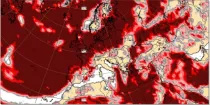
This chart shows probability information regarding wind speeds at 100 m above the earth's ...
Interval/period: N/A
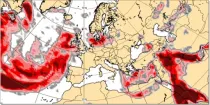
This chart shows probability information regarding CAPE shear derived from the ECMWF ensemble ...
Interval/period: N/A
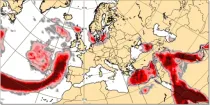
This chart shows probability information regarding MUCAPE derived from the ECMWF ensemble (ENS) ...
Interval/period: N/A
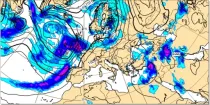
Precipitation totals include all precipitation types (rain, snow etc.) (in mm of rainfall or rainfall equivalent) falling in 6 hour or 12 hour periods using colour shading...
Interval/period: N/A
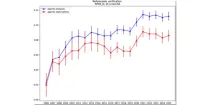
This diagram gives a measure of the effectiveness of the model. ...
Interval/period: N/A
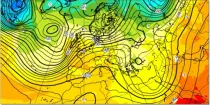
The 850 hPa level is usually just above the boundary layer and at this level the day-night variation in temperature is generally negligible...
Interval/period: N/A
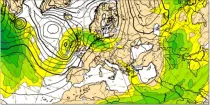
Wind speed at 200 hPa highlights the jet stream (areas of strong winds in the upper troposphere) which can help identify movement and development of depressions...
Interval/period: N/A
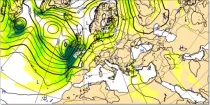
Wind speeds near the surface are roughly proportional to the distance between isobars so closely packed isobars mean strong surface winds...
Interval/period: N/A
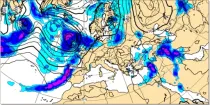
Precipitation totals include all precipitation types (rain, snow etc.) (in mm of rainfall or rainfall equivalent) falling in 6 hour or 12 hour periods using colour shading...
Interval/period: N/A

Significant wave height can be shown to correspond to the average wave height of the top one-third highest waves. The wave period of windsea is generally <10s,...
Interval/period: N/A
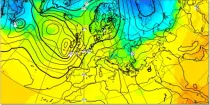
In the northern hemisphere the air rotates anti-clockwise around low contour centres and clockwise around the high contour centres. In the southern hemisphere the air rotates clockwise around low contour centres and ...
Interval/period: N/A
Total accumulated rainfall charts identify areas at greater risk of significant rainfall (or rain equivalent e.g.snowfall) but give no information regarding whether this occurs over a short or prolonged time period...
Interval/period: N/A
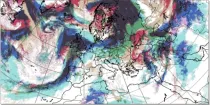
This display helps with the recognition of clouds of different layers, even when they overlap. Brighter colouring represents greater cloud cover. Cloud-free areas appear white while areas of full cloud cover at all levels appear dark grey (e.g. active fronts)...
Interval/period: N/A