
Datasets
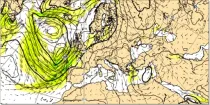
The air flow is not the same at all levels and can be very different in strength and direction when associated with vigorous weather systems...
Interval/period: N/A
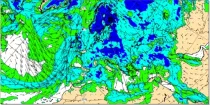
Uncoloured areas (relative humidity < 65%) are likely to be free of cloud. Coloured areas (relative humidity > 65%) show where moisture is likely to be available for cloud development...
Interval/period: N/A
This chart shows 7-day mean anomalies of wind speed and direction from the ECMWF Sub-seasonal ...
Interval/period: N/A
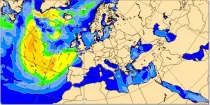
Mean windsea wave direction is the spectrally averaged direction of propagation of the windsea waves (weighted by wave height). Arrow length is proportional to the speed of wave propagation...
Interval/period: N/A
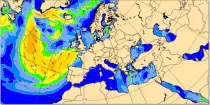
Significant windsea wave height can be shown to correspond to the average wave height of the top one-third highest windsea waves. Wave heights are shown in metres using colour shading...
Interval/period: N/A
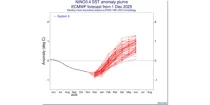
This chart provides information on the predicted evolution of the sea surface temperature (SST) ...
Interval/period: N/A
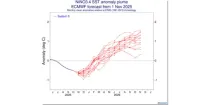
This chart provides information on the predicted evolution of the sea surface temperature (SST) ...
Interval/period: N/A
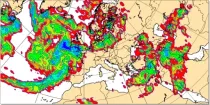
This chart is derived from the ECMWF ensemble (ENS) and shows the probability that the ...
Interval/period: N/A