
Datasets
Potential vorticity (PV) helps description and understanding of dynamic processes in the atmosphere by giving an indication of ascending or descending air flows and the development or weakening of ...
Interval/period: N/A
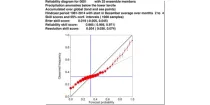
The reliability diagram shows the reliability of the ECMWF seasonal forecast system (SEAS5) with ...
Interval/period: N/A
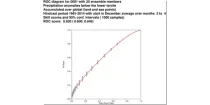
This chart shows the Relative Operating Characteristics (ROC) diagram for the three-month ...
Interval/period: N/A
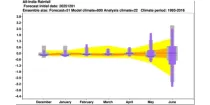
The ECMWF seasonal forecasts (SEAS5) are produced every month with a 51-member ensemble at ...
Interval/period: N/A
MUCAPE (Most Unstable Convective Available Potential Energy) is an indicator of atmospheric instability (the susceptibility of the troposphere to support free convection) and...
Interval/period: N/A
These charts aim to point towards areas where anomalous weather is likely to occur. ...
Interval/period: N/A
This chart shows 7-day mean anomalies for a range of parameters from the ECMWF Sub-seasonal ...
Interval/period: N/A
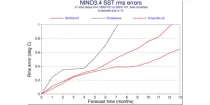
This chart provides a range of skill scores relating to forecasts of the evolution of the sea ...
Interval/period: N/A
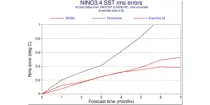
This chart provides a range of skill scores relating to forecasts of the evolution of the sea ...
Interval/period: N/A
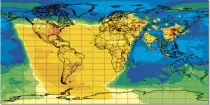
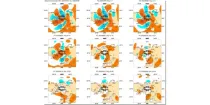
**Note:** In **June 2023** ECMWF implemented a **major upgrade ...**
Interval/period: N/A
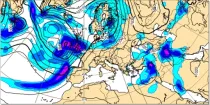
GraphCast (Google DeepMind): a deep learning-based system developed by Google DeepMind.It is initialised with ECMWF analysis. GraphCast operates at 0.25° resolution.
Interval/period: N/A
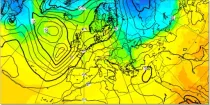
GraphCast (Google DeepMind): a deep learning-based system developed by Google DeepMind.It is initialised with ECMWF analysis. GraphCast operates at 0.25° resolution.
Interval/period: N/A
GraphCast (Google DeepMind): a deep learning-based system developed by Google DeepMind.It is initialised with ECMWF analysis. GraphCast operates at 0.25° resolution.
Interval/period: N/A
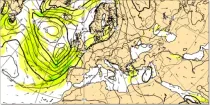
GraphCast (Google DeepMind): a deep learning-based system developed by Google DeepMind.It is initialised with ECMWF analysis. GraphCast operates at 0.25° resolution.
Interval/period: N/A
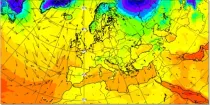
Pangu-Weather: a deep learning-based system developed by Huawei. It is initialised with ECMWF analysis. Pangu-Weather operates at 0.25° resolution.
Interval/period: N/A
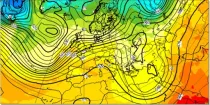
Pangu-Weather: a deep learning-based system developed by Huawei. It is initialised with ECMWF analysis. Pangu-Weather operates at 0.25° resolution.
Interval/period: N/A
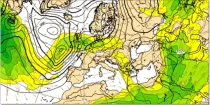
Pangu-Weather: a deep learning-based system developed by Huawei. It is initialised with ECMWF analysis. Pangu-Weather operates at 0.25° resolution.
Interval/period: N/A
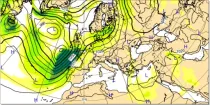
Pangu-Weather: a deep learning-based system developed by Huawei. It is initialised with ECMWF analysis. Pangu-Weather operates at 0.25° resolution.
Interval/period: N/A
Pangu-Weather: a deep learning-based system developed by Huawei. It is initialised with ECMWF analysis. Pangu-Weather operates at 0.25° resolution.
Interval/period: N/A
Pangu-Weather: a deep learning-based system developed by Huawei. It is initialised with ECMWF analysis. Pangu-Weather operates at 0.25° resolution.
Interval/period: N/A
This chart shows probability information regarding point precipitation, as derived from the ...
Interval/period: N/A
850 hPa wet-bulb potential temperature is commonly used to identify air masses and a strong gradient of wet bulb potential temperature is indicative of fronts between two different air masses...
Interval/period: N/A

The simulated water vapour images generally focus on the upper troposphere. These charts can often indicate dynamical forcing mechanisms (responsible for cyclogenesis) or convective development (related to potential instability)...
Interval/period: N/A