
Datasets

A subset of ECMWF real-time forecast data from the IFS and AIFS models is made available to the public free of charge. Their use is governed by the Creative Commons CC-BY-4.0 licence and the ECMWF Terms of Use.
Interval/period: N/A
ECMWF is now running version 2 of its Artificial Intelligence Forecasting System (AIFS). The AIFS consists of a deterministic model, AIFS Single, and an ensemble model, AIFS ENS.
The deterministic model has been running operationally since 25 February 2025 and was upgraded from AIFS Single v1.1 to AIFS Single v2 on 12 May 2026. Further details can be found on the dedicated Implementation of AIFS Single v1 page.
Interval/period: N/A
These products are available to the African Center of Meteorological Application for Development (ACMAD) countries.
Based on HRESThe products outlined below are disseminated via EUMETCast
Please refer to WMO Additional products for the equivalent products available on a global domain via the ECMWF's DCPC FTP server.
Interval/period: N/A
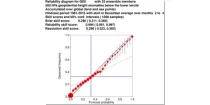
The reliability diagram shows the reliability of the ECMWF seasonal forecast system (SEAS5) with ...
Interval/period: N/A
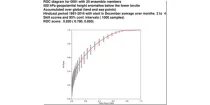
This chart shows the Relative Operating Characteristics (ROC) diagram for the three-month ...
Interval/period: N/A
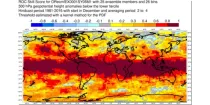
This chart shows the spatial variation in the Relative Operating Characteristics (ROC) skill ...
Interval/period: N/A

The ECMWF seasonal forecasts (SEAS5) are produced every month with a 51-member ensemble at a ...
Interval/period: N/A
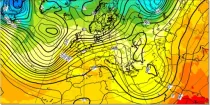
The 850 hPa level is usually just above the boundary layer and at this level the day-night variation in temperature is generally negligible...
Interval/period: N/A
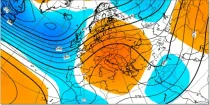
This chart shows 7-day mean anomalies of 500hPa geopotential height from the ECMWF Sub-seasonal ...
Interval/period: N/A
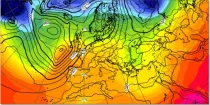
500-1000 hPa thickness is a measure of the mean temperature of a column of the atmosphere between these pressure levels and can be used to distinguish between warm and cold air masses and...
Interval/period: N/A
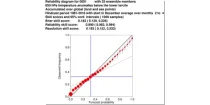
The reliability diagram shows the reliability of the ECMWF seasonal forecast system (SEAS5) with ...
Interval/period: N/A
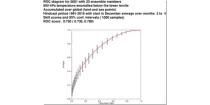
This chart shows the Relative Operating Characteristics (ROC) diagram for the three-month ...
Interval/period: N/A
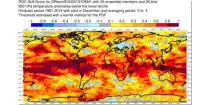
This chart shows the spatial variation in the Relative Operating Characteristics (ROC) skill ...
Interval/period: N/A
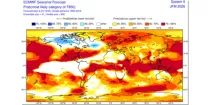
The ECMWF seasonal forecasts (SEAS5) are produced every month with a 51-member ensemble at a ...
Interval/period: N/A

This chart shows the spatial variation in the Anomaly Correlation Coefficient (ACC) for the ...
Interval/period: N/A
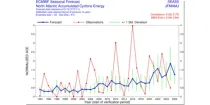
This chart provides information on the verification of forecasts of Accumulated Cyclone Energy ...
Interval/period: N/A
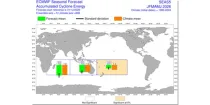
The ECMWF seasonal forecasts (SEAS5) are produced every month with a 51-member ensemble at a ...
Interval/period: N/A
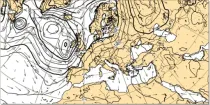
These charts show surface pressure patterns. Areas of high pressure (anticyclones) are usually associated with settled weather...
Interval/period: N/A
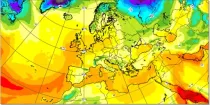
Dew Point Temperature at 2 m above the earth’s surface gives an indication of conditions which a person will experience or feel. High dewpoint temperatures inhibit heat loss from the body by perspriation and...
Interval/period: N/A
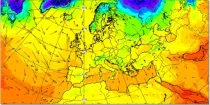
Temperatures at 2 m above the earth’s surface and winds at 10 m above the earth’s surface approximate most closely to the conditions that a person would experience.
Interval/period: N/A
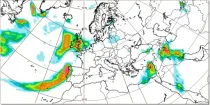
This chart shows probability information regarding point precipitation, as derived from the ...
Interval/period: N/A
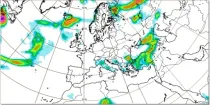
This chart shows probability information regarding point precipitation, as derived from the ...
Interval/period: N/A
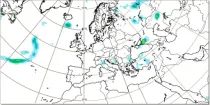
This chart shows probability information regarding point precipitation, as derived from the ...
Interval/period: N/A
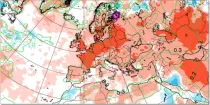
Detailed information on these EXPERIMENTAL products can be found
Interval/period: N/A