
Datasets

Ensemble forecast runs produced by the ECMWF Artificial Intelligence Forecasting System (AIFS) Ensemble model.
4 forecast runs per day (00/06/12/18) 6 hourly steps to 360 (15 days)More information can be found on the implementation page.
X-i: AIFS ENS forecastProduct description
Interval/period: N/A
On 12 May 2026, a new forecast stream will be produced by ECMWF's operational Artificial Intelligence Forecasting System ensemble model (AIFS ENS).
The new forecast stream is for wave forecast runs, marking ECMWF's first operational data-driven wave forecasts.
4 forecast runs per day (00/06/12/18) 6 hourly steps to 360 (15 days)XIII-i: AIFS forecast
Product description
Interval/period: N/A
Single forecast runs produced by the ECMWF Artificial Intelligence Forecasting System (AIFS) deterministic model.
Interval/period: N/A
On 12 May 2026, a new forecast stream will be produced by ECMWF's operational Artificial Intelligence Forecasting System deterministic model (AIFS Single).
The new forecast stream is for wave forecast runs, marking ECMWF's first operational data-driven wave forecasts.
4 forecast runs per day (00/06/12/18) 6 hourly steps to 360 (15 days)XII-i: Deterministic AIFS forecast
Product description
Interval/period: N/A
Ensemble (ENS) of forecasts providing an estimate of the reliability of a single forecast. Currently there are 50 perturbed members in the ensemble.
ENS offers "High Frequency products" until step 144:
Interval/period: N/A
This licence provides access to ECMWF interactive ecCharts tool to visualise analysis and forecast products Please note that access to the ecCharts is for End User use only (internal).
ECMWF ecCharts web service is available and we are pleased to be able to offer the service for evaluation to customers of ECMWF's web products.
Interval/period: N/A
The sub-seasonal products comprise ensembles of individual forecasts up to 46 days and post-processed products of average conditions (e.g. weekly averages) and the associated uncertainty.
The purchase of the "Basic Set" +72, +96, +120, +144, +168 hrs is a mandatory prerequisite for the purchase of time steps in the range 12 to 66 hours.
The following sub-sets are available from the sub-seasonal forecast (46 days):
Interval/period: N/A
SEAS comprises ensembles of individual forecasts coupled to an ocean model and post-processed products of average conditions (e.g. monthly averages) with the associated uncertainty. Products are available up to 7 months ahead.
The following sub-sets are available:
V-i: Monthly means of ensemble meansField computed from data of the daily individual forecast runs (section V-v) and averaged over all ensemble members. The fields are provided in GRIB code.
Interval/period: N/A
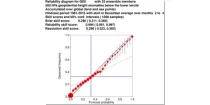
The reliability diagram shows the reliability of the ECMWF seasonal forecast system (SEAS5) with ...
Interval/period: N/A
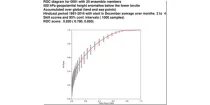
This chart shows the Relative Operating Characteristics (ROC) diagram for the three-month ...
Interval/period: N/A
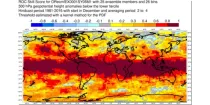
This chart shows the spatial variation in the Relative Operating Characteristics (ROC) skill ...
Interval/period: N/A

The ECMWF seasonal forecasts (SEAS5) are produced every month with a 51-member ensemble at a ...
Interval/period: N/A
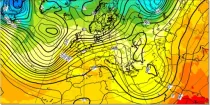
The 850 hPa level is usually just above the boundary layer and at this level the day-night variation in temperature is generally negligible...
Interval/period: N/A
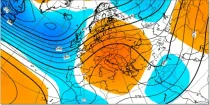
This chart shows 7-day mean anomalies of 500hPa geopotential height from the ECMWF Sub-seasonal ...
Interval/period: N/A
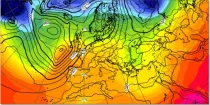
500-1000 hPa thickness is a measure of the mean temperature of a column of the atmosphere between these pressure levels and can be used to distinguish between warm and cold air masses and...
Interval/period: N/A
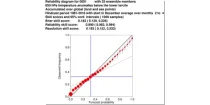
The reliability diagram shows the reliability of the ECMWF seasonal forecast system (SEAS5) with ...
Interval/period: N/A
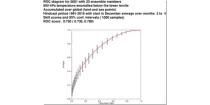
This chart shows the Relative Operating Characteristics (ROC) diagram for the three-month ...
Interval/period: N/A
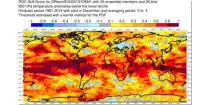
This chart shows the spatial variation in the Relative Operating Characteristics (ROC) skill ...
Interval/period: N/A
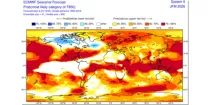
The ECMWF seasonal forecasts (SEAS5) are produced every month with a 51-member ensemble at a ...
Interval/period: N/A

This chart shows the spatial variation in the Anomaly Correlation Coefficient (ACC) for the ...
Interval/period: N/A
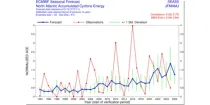
This chart provides information on the verification of forecasts of Accumulated Cyclone Energy ...
Interval/period: N/A
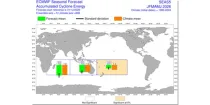
The ECMWF seasonal forecasts (SEAS5) are produced every month with a 51-member ensemble at a ...
Interval/period: N/A
These charts show surface pressure patterns. Areas of high pressure (anticyclones) are usually associated with settled weather...
Interval/period: N/A
Dew Point Temperature at 2 m above the earth’s surface gives an indication of conditions which a person will experience or feel. High dewpoint temperatures inhibit heat loss from the body by perspriation and...
Interval/period: N/A