
Datasets

The ECMWF OCEAN5 system is a new global eddy-permitting ocean-sea ice ensemble reanalysis analysis system. This Technical Memorandum gives a full description of the OCEAN5 system, with the focus on its Behind-Real-Time (BRT) component, the reanalysis product ORAS5. The OCEAN5 Real-Time (RT) component includes all upgrades developed for ORAS5 and runs daily using the latest observations and forcing fields from the operational Numerical Weather Prediction (NWP).
Interval/period: N/A
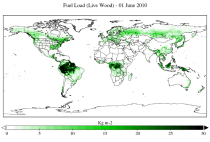
The two main variable groups are fuel load and fuel moisture, both of which are further divided by live/dead and wood/foliage fractions.
The dataset combines state-of-the-art model data (ERA5-Land) with observations from multiple satellites and in-situ variables into a globally complete and consistent dataset.
Interval/period: Wed, 01/01/2003 - Fri, 12/31/2021
**Note:** In **June 2023** ECMWF implemented a **major upgrade ...**
Interval/period: N/A
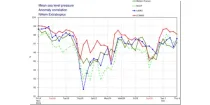
These diagrams compare recent ECMWF verification scores for Mean Sea Level Pressure with ...
Interval/period: N/A
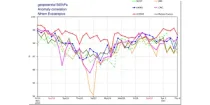
These diagrams compare recent ECMWF verification scores for 500 hPa height with those of other ...
Interval/period: N/A
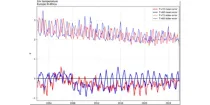
This diagram shows mean and standard deviation of errors in the HRES forecasts for several ...
Interval/period: N/A
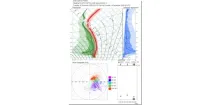
The Vertical Profiles display the vertical structure of the forecast model atmosphere in a familiar user friendly way. The vertical structure of temperatures (red) dewpoints (green) and dewpoint depressions (blue) from each ENS member ...
Interval/period: N/A
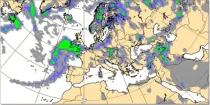
Predicting near surface visibility is dependent on predicting the correct dynamic and thermodynamic conditions in the boundary layer which can be highly variable. Fog is an extremely important weather hazard...
Interval/period: N/A
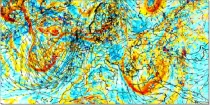
The movement or transfer of vorticity helps in the assessment of vertical motion of air (ascent) in the troposphere. Where a local vorticity maximum approaches an area there is a tendency for air to rise and where a local vorticity maximum moves ...
Interval/period: N/A
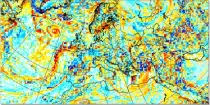
Vorticity is the tendency of an air particle to rotate or circulate around a particular point. Relative Vorticity is a measure about a vertical axis of the local rotation or spin of the air relative...
Interval/period: N/A
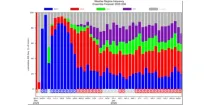
This diagram shows daily probabilities for four types of Euro-Atlantic weather regimes over ...
Interval/period: N/A
The DestinE Digital Twin for Weather-Induced Extremes (Extremes DT) supports responding and adapting to extreme events in a changing world by providing a capability to produce tailored simulations and address what-if scenarios related to extreme events in a past, present and future climate, complementing existing capabilities at national and European level.
Interval/period: N/A
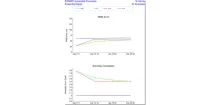
**Note:** In **June 2023** ECMWF implemented a **major upgrade ...**
Interval/period: N/A
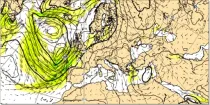
The air flow is not the same at all levels and can be very different in strength and direction when associated with vigorous weather systems...
Interval/period: N/A
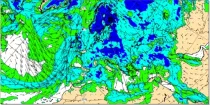
Uncoloured areas (relative humidity < 65%) are likely to be free of cloud. Coloured areas (relative humidity > 65%) show where moisture is likely to be available for cloud development...
Interval/period: N/A
This chart shows 7-day mean anomalies of wind speed and direction from the ECMWF Sub-seasonal ...
Interval/period: N/A
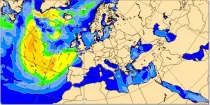
Mean windsea wave direction is the spectrally averaged direction of propagation of the windsea waves (weighted by wave height). Arrow length is proportional to the speed of wave propagation...
Interval/period: N/A
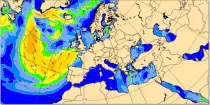
Significant windsea wave height can be shown to correspond to the average wave height of the top one-third highest windsea waves. Wave heights are shown in metres using colour shading...
Interval/period: N/A
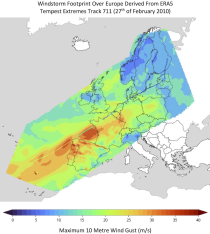
Interval/period: Thu, 02/01/1940 - Fri, 01/23/2026
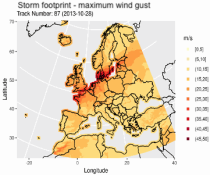
Interval/period: Sat, 03/01/1986 - Wed, 11/30/2011
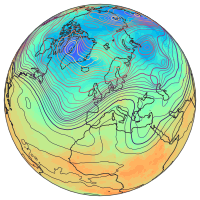
Data is available from 1940 onwards.
ERA5 replaces the ERA-Interim reanalysis.
Interval/period: Mon, 01/01/1940 - Thu, 06/25/2026
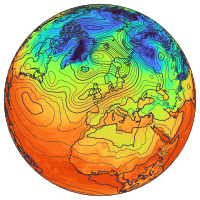
Data is available from 1940 onwards.
ERA5 replaces the ERA-Interim reanalysis.
Interval/period: Mon, 01/01/1940 - Thu, 06/25/2026
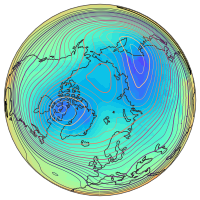
Data is available from 1940 onwards.
ERA5 replaces the ERA-Interim reanalysis.
Interval/period: Mon, 01/01/1940 - Fri, 05/01/2026
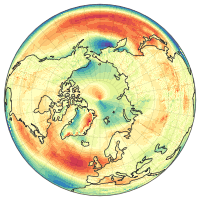
Data is available from 1940 onwards.
ERA5 replaces the ERA-Interim reanalysis.
Interval/period: Mon, 01/01/1940 - Fri, 05/01/2026