
Datasets

HRES-WAM (High RESolution WAve Model) is coupled to the atmospheric model (HRES) and it is a Direct model output Products offers "High Frequency products":
4 forecast runs per day (00/06/12/18) (see dissemination schedule for details) Hourly steps to step 90 for all four runsThe model computes between the latitudes -78 and 90, the output grid is artificially extended to -90.
Interval/period: N/A
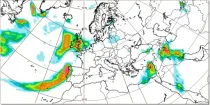
This chart shows probability information regarding point precipitation, as derived from the ...
Interval/period: N/A
The SOFF (Systematic Observations Financing Facility) initiative from the WMO is aimed at supporting beneficiary countries to generate and exchange GBON (Global Basic Observing Network) data. These data are critical for improved weather forecasts and climate services.
Interval/period: N/A
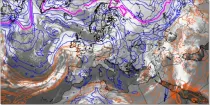
850 hPa wet-bulb potential temperature is commonly used to identify air masses and a strong gradient of wet bulb potential temperature is indicative of fronts between two different air masses...
Interval/period: N/A

The simulated water vapour images generally focus on the upper troposphere. These charts can often indicate dynamical forcing mechanisms (responsible for cyclogenesis) or convective development (related to potential instability)...
Interval/period: N/A
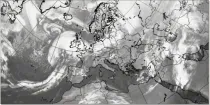
These products display cloud-related fields from the model in a format that is very familiar to forecasters and that they are used to interpreting. They can easily be compared to actual satellite imagery...
Interval/period: N/A
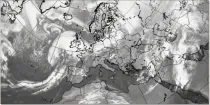
The simulated water vapour images generally focus on the upper troposphere. These charts can often indicate dynamical forcing mechanisms (responsible for cyclogenesis) or convective development (related to potential instability)...
Interval/period: N/A
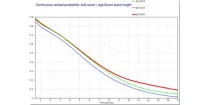
These diagrams compare Continuous Ranked Probability Skill Scores (CRPSS) of ECMWF with ...
Interval/period: N/A
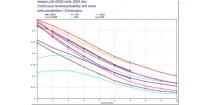
These diagrams compare the Brier Skill Scores (BSS) and the Continuous Ranked Probability ...
Interval/period: N/A
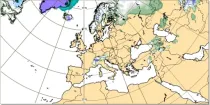
Snow depth is computed using two model parameters - these represent the liquid water equivalent of snow lying on the ground, and the average density of that snow layer...
Interval/period: N/A
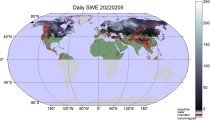
Interval/period: Tue, 01/02/1979 - Sun, 08/09/2026
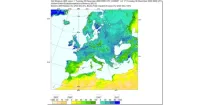
Soil moisture handling in the model is complex, and could be highlighted in many ways. Here a 'relativistic' approach is used for display, showing not absolute values, but instead...
Interval/period: N/A
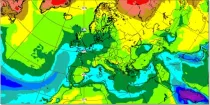
Specific humidity gives an indication of the amount of moisture within a sample of air (in g of water vapour within a kg of air, g kg⁻¹). The chart shows the specific humidity at 1000 hPa and 925 hPa levels and...
Interval/period: N/A
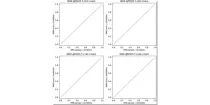
These reliability diagrams show the ensemble spread of different global models for temperature ...
Interval/period: N/A
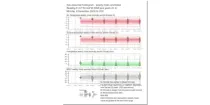
This chart shows the 7-day mean anomalies of four forecast parameters for the Sub-seasonal range ...
Interval/period: N/A
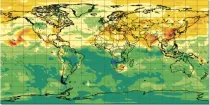
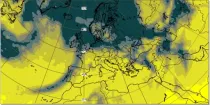
Sunshine for any point is assessed using the model representation of cloud layers to decide how much direct solar (shortwave) radiation reaches the Earth's surface...
Interval/period: N/A
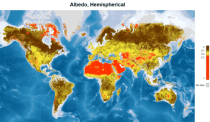
Interval/period: Tue, 09/01/1981 - Sun, 12/01/2024
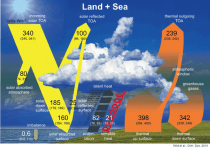
Interval/period: Mon, 01/01/1979 - Mon, 06/30/2025
This chart shows probabilities for the 7-day mean anomalies of surface temperature to be in ...
Interval/period: N/A
This chart shows probabilities that 7-day mean surface temperatures (from the 101 forecast ...
Interval/period: N/A
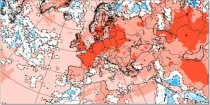
This chart shows 7-day mean anomalies of surface temperature from the ECMWF Sub-seasonal range ...
Interval/period: N/A
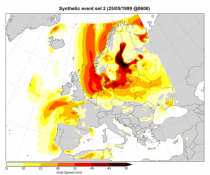
Interval/period: Wed, 01/01/1986 - Wed, 11/30/2011
An eddy-permitting ocean reanalysis spanning the period 1979–2012. Includes increased horizontal and vertical resolution, an prognostic sea-ice component, new versions of the ocean and data assimilation system, revised surface fluxes, new version and treatment of satellite sea surface height data, and assimilation of sea-ice concentration, among others.
Interval/period: N/A
Uses a sophisticated data assimilation methodology which includes a model bias correction. The ocean model used is forced by atmospheric daily surface fluxes, relaxed to SST and bias corrected.
Interval/period: N/A