
Datasets
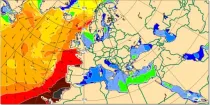
Mean total swell wave direction is the spectrally averaged propagation direction of the swell waves (weighted by wave height) of the part of the spectrum that is NOT windsea...
Interval/period: N/A
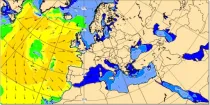
Wave height is the vertical distance between trough and crest. Wave period is the time between the passage of one wave crest and the next. The arrow direction is the direction the waves are moving towards...
Interval/period: N/A
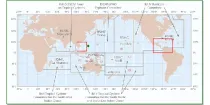
These charts provide information on current Tropical Cyclone activity. Select the ...
Interval/period: N/A
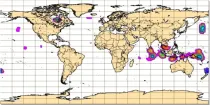
This chart shows the potential for tropical cyclone activity at different time ranges during the ...
Interval/period: N/A
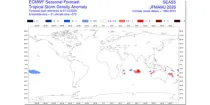
The ECMWF seasonal forecasts (SEAS5) are produced every month with a 51-member ensemble at a ...
Interval/period: N/A
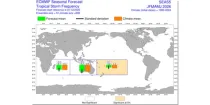
The ECMWF seasonal forecasts (SEAS5) are produced every month with a 51-member ensemble at a ...
Interval/period: N/A
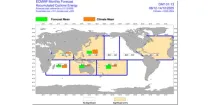
The charts show mean frequency and accumulated cyclone energy of tropical storm activity. ...
Interval/period: N/A
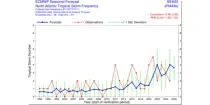
This chart provides information on the verification of forecasts of the expected number of ...
Interval/period: N/A
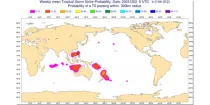
The charts show the evolution of existing and potential tropical cyclone activity. ...
Interval/period: N/A
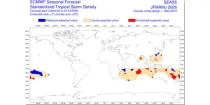
The ECMWF seasonal forecasts (SEAS5) are produced every month with a 51-member ensemble at a ...
Interval/period: N/A
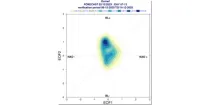
These diagrams show the evolution of regimes indicative of likely weather by week around ...
Interval/period: N/A
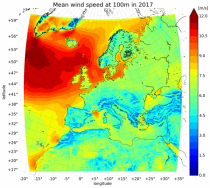
Interval/period: Thu, 10/18/2018 - Wed, 07/31/2019
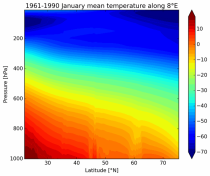
It has been generated using the UERRA-HARMONIE system by combining model data with observations into a complete and consistent dataset using the laws of physics.
Interval/period: Thu, 10/18/2018 - Wed, 07/31/2019
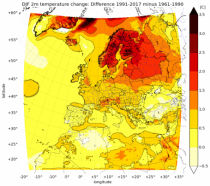
UERRA-HARMONIE and MESCAN-SURFEX systems. Forecasts up to 30 hours initialised
from the analyses at 00 and 12 UTC are available only through the CDS-API (see Documentation).
UERRA-HARMONIE is a 3-dimensional variational data assimilation system,
while MESCAN-SURFEX is a complementary surface analysis system.
Using the Optimal Interpolation method, MESCAN provides the best estimate of daily accumulated precipitation
Interval/period: Thu, 10/18/2018 - Wed, 07/31/2019
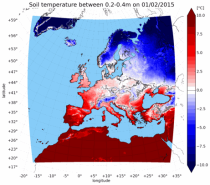
combined with observations using the UERRA-HARMONIE system and MESCAN-SURFEX system.
UERRA-HARMONIE is a 3-dimensional data assimilation system, whereas
MESCAN-SURFEX is a complementary surface analysis system. In general, the
assimilation systems are able to estimate biases between observations and to
sift good-quality data from poor data. The laws of physics allow for estimates
Interval/period: Thu, 10/18/2018 - Wed, 07/31/2019
Interval/period: Tue, 07/05/1994 - Sun, 02/28/2021
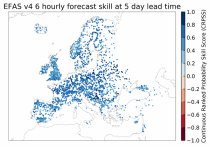
River discharge
Volumetric soil moisture
Snow water equivalent
Soil wetness index (root zone)
Runoff water equivalent (surface plus subsurface)
Interval/period: Wed, 10/14/2020 - Sun, 08/09/2026
Interval/period: Sun, 01/03/1999 - Sat, 11/25/2023
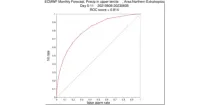
**Note:** In **June 2023** ECMWF implemented a **major upgrade ...**
Interval/period: N/A
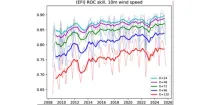
This diagram shows the variation of Relative Operating Characteristics (ROC) scores with various ...
Interval/period: N/A
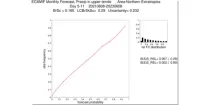
**Note:** In **June 2023** ECMWF implemented a **major upgrade ...**
Interval/period: N/A
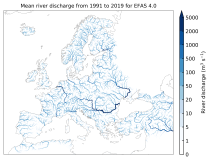
This dataset provides gridded modelled hydrological time series forced with medium-range meteorological forecasts. The data is a consistent representation of the most important hydrological variables across the European Flood Awareness System (EFAS) domain. The temporal resolution is sub-daily high-resolution and ensemble forecasts of:
River discharge
Soil moisture for three soil layers
Snow water equivalent
Interval/period: N/A
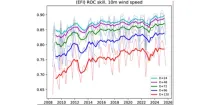
This diagram gives a measure of the effectiveness of the model. The drop-down menu can ...
Interval/period: N/A
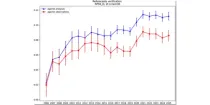
This diagram gives a measure of the effectiveness of the model. ...
Interval/period: N/A
**Note:** In **June 2023** ECMWF implemented a **major upgrade ...**
Interval/period: N/A