
Datasets
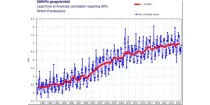
This diagram gives a measure of the effectiveness of the model by showing when the ACC of 500 ...
Interval/period: N/A
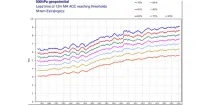
This diagram gives a measure of the effectiveness of the model by showing when the ACC of ...
Interval/period: N/A
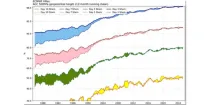
This diagram gives a measure of the effectiveness of the model in forecasting 500 hPa heights at ...
Interval/period: N/A
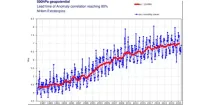
This diagram gives a measure of the effectiveness of the model by showing when the ACC of 500 ...
Interval/period: N/A
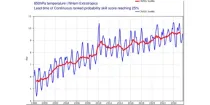
This diagram gives a measure of the effectiveness of the model by showing how far ahead in the ...
Interval/period: N/A
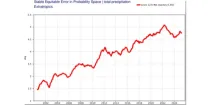
This diagram gives a measure of the effectiveness of the model by showing when the 1-SEEPS of ...
Interval/period: N/A
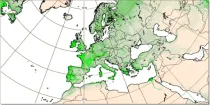
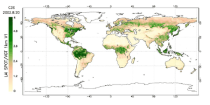
The leaf area index determines the degree of evapotranspiration. The index varies in a climatological way in the model, month by month (and so will not change in a different way if there is anomalous weather)...
Interval/period: N/A
Interval/period: Tue, 09/01/1981 - Sun, 12/01/2024
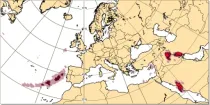
Lightning flash densities are diagnosed from forecast values of hydrometeor content, CAPE (convective available potential energy), and cloud base height that has been output by the convection scheme...
Interval/period: N/A
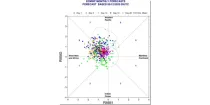
This diagram shows time evolution of a Madden-Julian Oscillation (MJO) index. ...
Interval/period: N/A
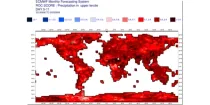
**Note:** In **June 2023** ECMWF implemented a **major upgrade ...**
Interval/period: N/A
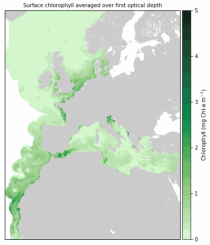
Interval/period: Mon, 01/01/1979 - Mon, 12/31/2018
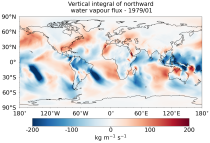
The vertically integrated budget diagnostics include the tendencies and lateral fluxes of total energy, water vapour, and latent heat (with the latent heat of vaporization varying with temperature). In addition, the divergences of the lateral fluxes are provided.
Interval/period: Mon, 01/01/1979 - Tue, 08/11/2026
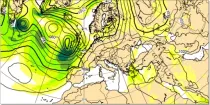
Maximum Wind gusts at 10 m above the earth's surface during the 6 hour period previous to the selected validity time are shown using colour shading. 10 m wind gusts are a post-processed product...
Interval/period: N/A
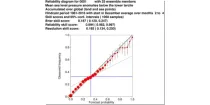
The reliability diagram shows the reliability of the ECMWF seasonal forecast system (SEAS5) with ...
Interval/period: N/A
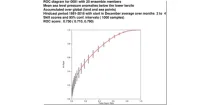
This chart shows the Relative Operating Characteristics (ROC) diagram for the three-month ...
Interval/period: N/A
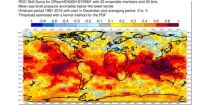
This chart shows the spatial variation in the Relative Operating Characteristics (ROC) skill ...
Interval/period: N/A
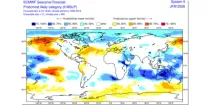
The ECMWF seasonal forecasts (SEAS5) are produced every month with a 51-member ensemble at a ...
Interval/period: N/A
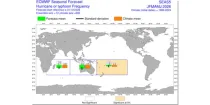
The ECMWF seasonal forecasts (SEAS5) are produced every month with a 51-member ensemble at a ...
Interval/period: N/A
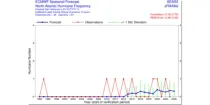
This chart provides information on the verification of forecasts of the number of tropical ...
Interval/period: N/A
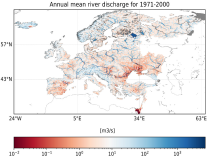
ECV datasets provide the empirical evidence needed to understand the current climate and predict future changes.
Interval/period: N/A
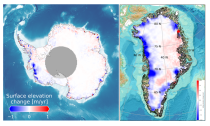
Interval/period: Wed, 01/01/1992 - Tue, 08/11/2026
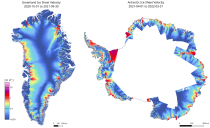
Interval/period: Sun, 10/01/2017 - Tue, 08/11/2026
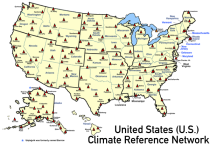
United States Climate Reference Network (USCRN) stations.
There are over 130 USCRN stations over the conterminous United States (U.S.), Alaska, and Hawaii.
The USCRN stations are managed and maintained by the U.S. National Oceanic and Atmospheric Administration (NOAA).
The USCRN observations include air temperature, humidity, wind speed, precipitation, solar radiation,
Interval/period: Sun, 01/01/2006 - Tue, 08/11/2026
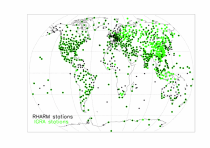
The first is version 2 of the Integrated Global Radiosounding Archive (IGRA) from 1978 which incorporates global
radiosounding profiles of temperature, humidity and wind from a large number of data sources,
which is 30% larger than the previous version 1. IGRA v2 is the result of quality assurance procedures applied to the
Interval/period: Sun, 01/01/1978 - Tue, 08/11/2026