
Datasets
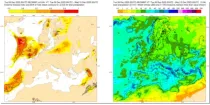
These charts aim to provide pointers to areas where anomalous precipitation amounts are likely to occur during the 24 hour, 2 day, 5 day or 10 day period previous to the selected validity time...
Interval/period: N/A
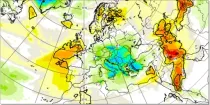
This chart aims to highlight areas where unusually anomalous precipitation is likely to ...
Interval/period: N/A
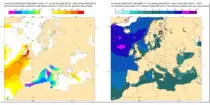
These charts show areas where anomalous significant wave heights are likely to occur. These charts are based on the ECMWF ense ...
Interval/period: N/A
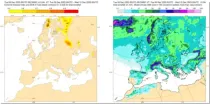
These charts show areas where anomalous snow fall is likely to occur. These charts are based on the ECMWF ensemble for ...
Interval/period: N/A
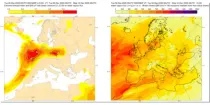
These charts aim to provide pointers to areas where anomalous values of water vapour flux are likely to occur based on the ECMWF en ...
Interval/period: N/A
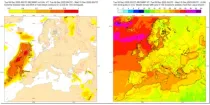
These charts show areas where anomalous 10 m wind gusts are likely to occur. These charts are based on the ECMWF ensemble fore ...
Interval/period: N/A
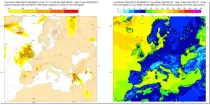
These charts show areas where anomalous 10 m wind speeds are likely to occur. These charts are based on the ECMWF ensemble for ...
Interval/period: N/A
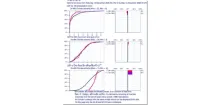
Cumulative Density Functions (CDF) describes the distribution of the values of a variable (e.g.temperature) as forecast by the ENS ensemble members. The CDF curve shows the proportion (in %) of ENS members...
Interval/period: N/A
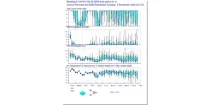
Meteograms show a probabilistic interpretation of the ENS forecasts for specific locations using a box and whisker plot. It shows the time evolution of the distribution of several meteorological parameters on a single diagram...
Interval/period: N/A
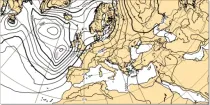
Ensemble Mean Sea Level Pressure (MSLP) is the mean MSLP of the ensemble members (in hPa) and detail is smoothed out. These charts show surface pressure patterns...
Interval/period: N/A
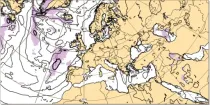
Spread usually, but not always, increases with forecast range. Spread refers to the uncertainty of the values of a parameter but it does not necessarily refer to the flow patterns...
Interval/period: N/A
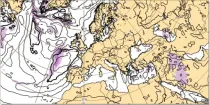
The ensemble mean is the mean value derived from all the 50 ensemble members plus the control member. This value attempts to capture the general picture while smoothing out spurious detail...
Interval/period: N/A
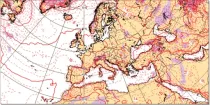
The ensemble spread is a measure of the differences between the 50 ensemble members plus the control member and is represented by the standard deviation with respect to the ensemble mean...
Interval/period: N/A
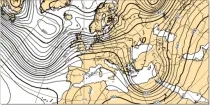
These charts show the mean and variation in the latest ECMWF ensemble forecast (ENS). ...
Interval/period: N/A
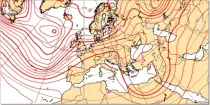
These charts show the mean and variation in the latest ECMWF ensemble forecast (ENS). ...
Interval/period: N/A
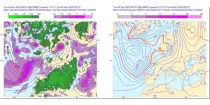
These charts show the mean and variation in the latest ECMWF ensemble forecast (ENS). ...
Interval/period: N/A
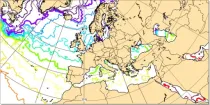
Spread refers to the uncertainty of the values of a parameter but it does not necessarily refer to the flow patterns...
Interval/period: N/A
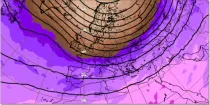
These charts show the mean and variation in the latest ECMWF ensemble forecast (ENS). ...
Interval/period: N/A
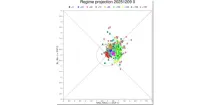
These diagrams aim to show the time evolution of regimes which are indicative of the likely weather in and around Europe.The winds across the Atlantic can usefully be classified into four regimes ...
Interval/period: N/A
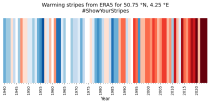
Data is available from 1940 onwards. ERA5 replaces the ERA-Interim reanalysis.
Interval/period: Mon, 01/01/1940 - Fri, 12/06/2024
Fifth Generation of the European Centre for Medium-Range Weather Forecasts (ECMWF) Reanalysis (ERA5).
Produced by replaying only the land component of the ECMWF ERA5 climate reanalysis, it benefits from the same physical data-assimilation framework but runs offline at
higher spatial detail (9 km grid) to deliver richer land-surface information.
Interval/period: Sun, 01/01/1950 - Thu, 12/31/2026
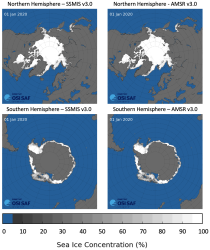
This dataset provides daily gridded data of sea ice concentration for both hemispheres derived from satellite passive microwave brightness temperatures. Sea ice is an important component of our climate system and a sensitive indicator of climate change. Its presence or its retreat has a strong impact on air-sea interactions, the Earth’s energy budget as well as marine ecosystems. It is listed as an Essential Climate Variable by the Global Climate Observing System.
Interval/period: N/A
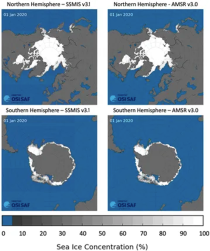
Interval/period: Sun, 10/01/1978 - Mon, 09/29/2025
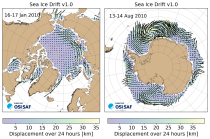
Interval/period: Tue, 01/01/1991 - Thu, 12/31/2020
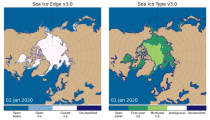
This dataset provides daily gridded data of sea ice edge and sea ice type derived from brightness temperatures measured by satellite passive microwave radiometers. Sea ice is an important component of our climate system and a sensitive indicator of climate change. Its presence or its retreat has a strong impact on air-sea interactions, the Earth’s energy budget as well as marine ecosystems. It is recognized by the Global Climate Observing System as an Essential Climate Variable. Sea ice edge and type are some of the parameters used to characterise sea ice.
Interval/period: N/A