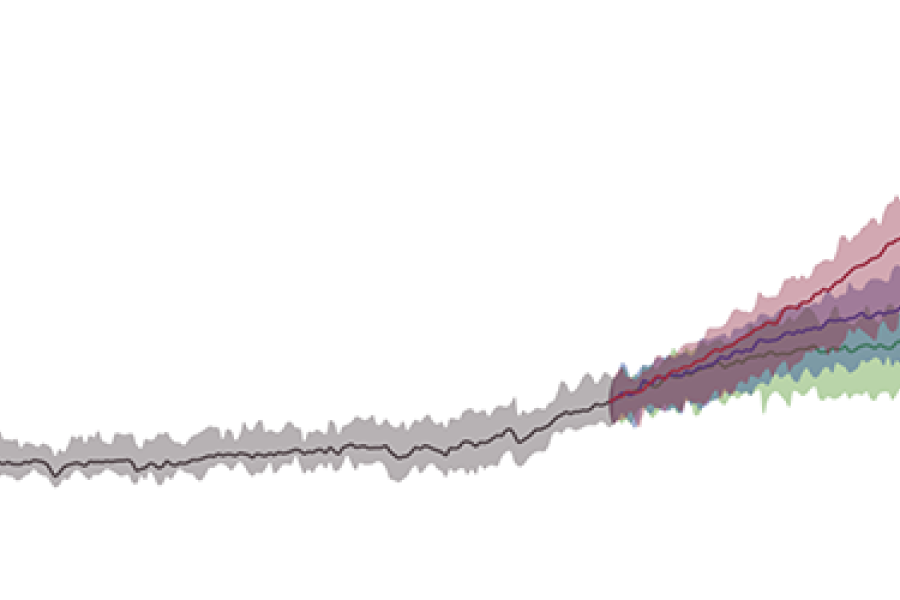
This lesson teaches about sources of uncertainty in climate projections, what robust signals are, and when we can be confident in a change.
This lesson teaches about downscaling and bias correction methods. An exercise for bias correction is included.
This lesson covers how climate change impacts the agriculture sector. Responses of different crop types to climate change is explained. Adaptation measures are introduced and how CDS data can be used ...
Uncover how climate models work and how they can be evaluated. Differences between climate projections, predictions and scenarios are explained.
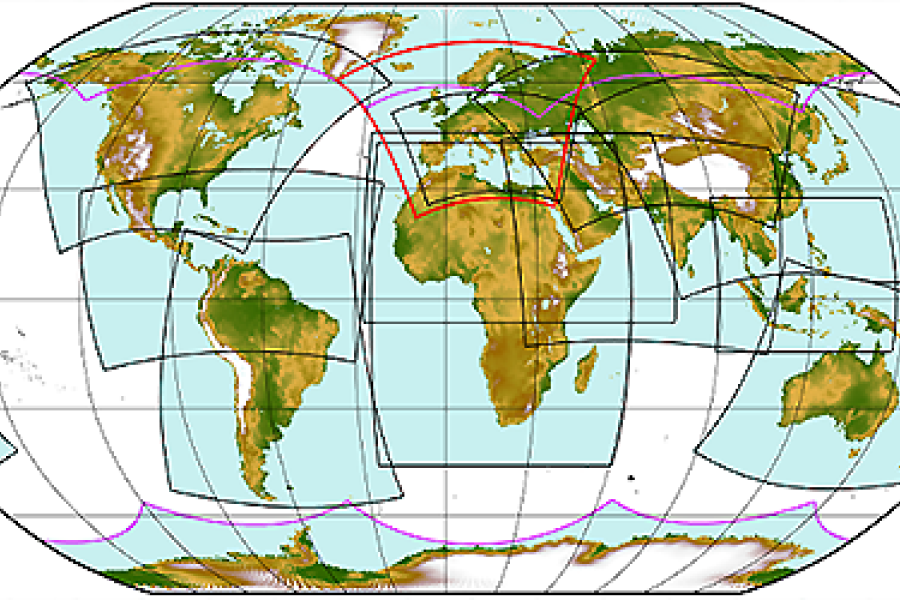
About climate projections, differences between climate models, and how to choose from climate projection data.
This lesson will take you through what convection is and the phenomena it causes.
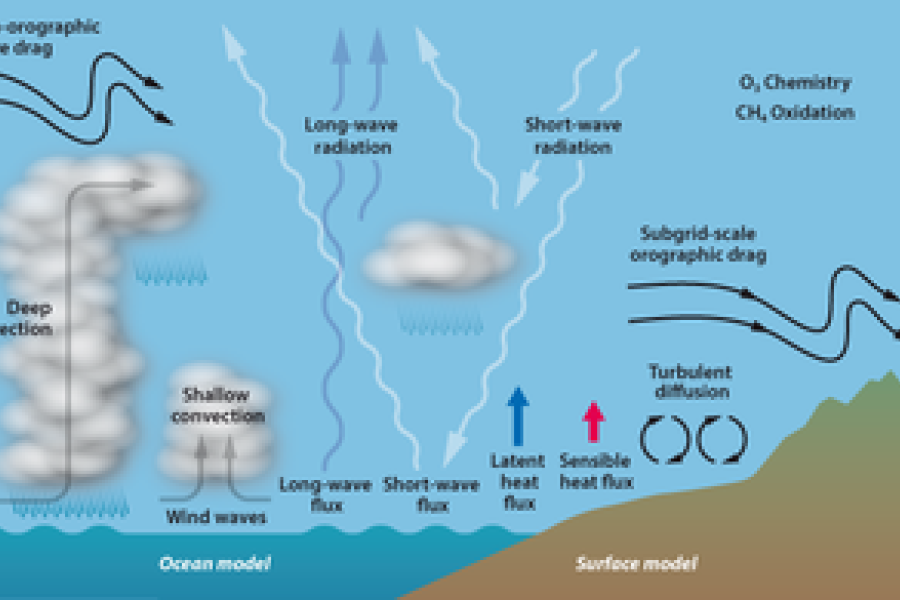
This lesson looks at the three classes of parametrization schemes and the main characteristics of the IFS scheme.
Six modules introducing the main topics in machine learning in the context of weather and climate.
Explore the key microphysical and warm-phase processes of cloud and precipitation parametrisation and their use in NWP.
Learn about sources of error in NWP, how they are quantified, and how ensembles are evaluated.
This lesson covers key processes in ice and mixed-phase clouds and precipitation, and parametrization uncertainties.
Learn how sub-grid-scale processes (not explicitly simulated in NWP), are parameterised and how challenges are overcome.