Showing 37 - 48 of 71 results
Analyzing Ocean Colour and Sea Surface Temperature during El Niño and La Niña Events

Analyzing Ocean Colour and Sea Surface Temperature during El Niño and La Niña Events

Format: Jupyter notebooks

OC and SST datasets from CDS: subset and download, visualise time series, aggregate daily to monthly, calculate anomalies

Looking at Sea Level and derived Surface Current data

Looking at Sea Level and derived Surface Current data

Format: Jupyter notebooks

Practical introduction to the Sea level gridded data: plotting data during an El Niño event and over a strong current

Exploring the Climate Change Service (C3S) Surface Albedo product available through the Climate Data Store (CDS)

Exploring the Climate Change Service (C3S) Surface Albedo product available through the Climate Data Store (CDS)

Format: Jupyter notebooks

Surface Albedo product. Three case studies: data retrieval, visualisation, time-series creation, set up Python environment

Computing the time average of LAI and fAPAR using inverse variance weights

Computing the time average of LAI and fAPAR using inverse variance weights

Format: Jupyter notebooks

LAI and fAPAR retrieved with satellite remote sensing. Computation of inverse variance weights

Seasonal forecast verification

Seasonal forecast verification

Format: Jupyter notebooks

Access hindcast data of 2-metre temperature; Compute anomalies, averages and verification metrics.

Plot an ensemble of CMIP6 climate projections

Plot an ensemble of CMIP6 climate projections

Format: Jupyter notebooks

Access CMIP6 global climate projections from the C3S Climate Data Store, plot projected 2m temperature from model ensemble.

Analysis of projected versus historical climatology with CORDEX data

Analysis of projected versus historical climatology with CORDEX data

Format: Jupyter notebooks

Introduction to CORDEX regional climate model data on single levels. Compute difference in air temperature climatologies.

Tutorial on climatologies using climate data from C3S

Tutorial on climatologies using climate data from C3S

Format: Jupyter notebooks

Access ERA5 data from the C3S Climate Data Store. Analyse climatologies and trends in near-surface air temperature.

Seasonal Forecast Anomalies

Seasonal Forecast Anomalies

Format: Jupyter notebooks

Introduction to calculating seasonal forecast anomalies. Visualisation as spatial maps, time series and interactive plot

The ECMWF sub-seasonal (extended range) forecasts: Introduction

The ECMWF sub-seasonal (extended range) forecasts: Introduction

Format: Interactive modules (eLearning)

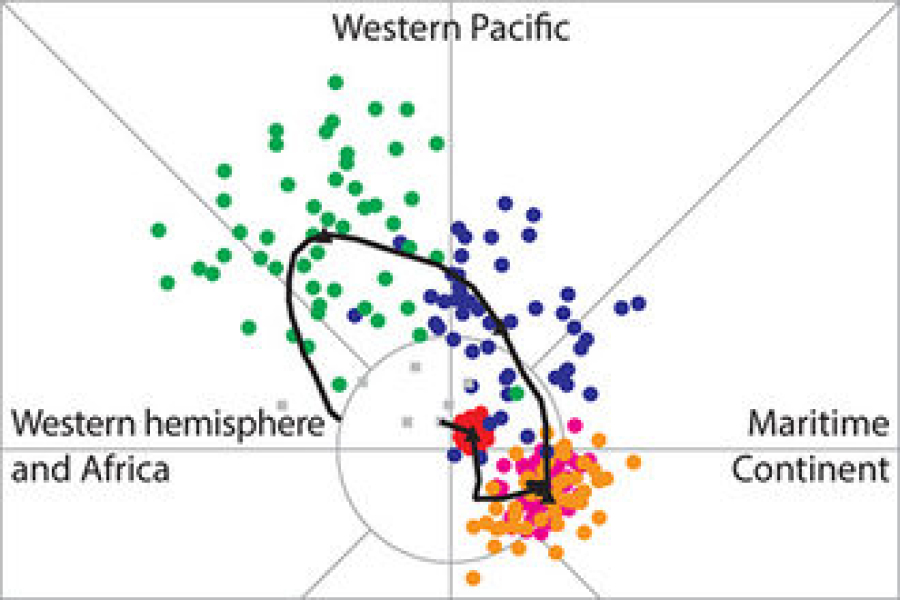
Learn about sources of predictability, seasonal forecast skill and the ECMWF sub-seasonal forecasting system.

The Extreme Forecast Index (EFI) and the Shift Of Tail (SOT) index

The Extreme Forecast Index (EFI) and the Shift Of Tail (SOT) index

Format: Interactive modules (eLearning)

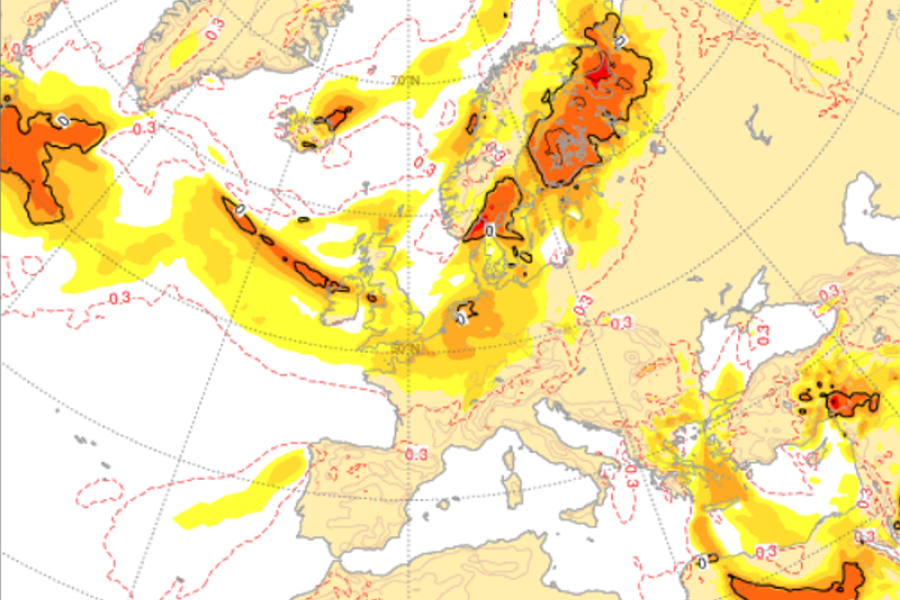
Learn how EFI, SOT and Model Climate are built and provide forecast guidance for extreme, or severe weather events.

Forecast Jumpiness: An introduction

Forecast Jumpiness: An introduction

Format: Interactive modules (eLearning)

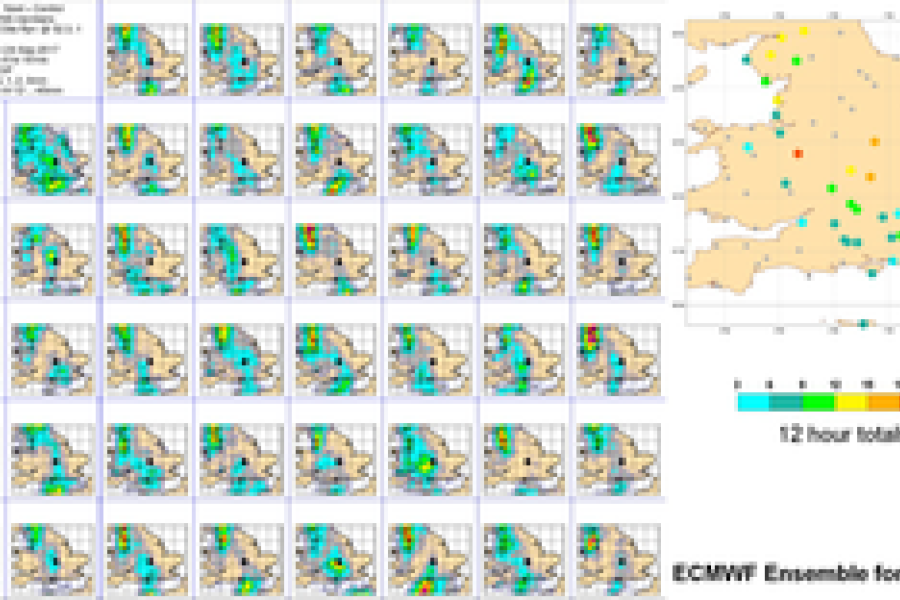
Learn about the ways in which forecast jumpiness can appear and how it can be mitigated.