Comparing TROPOMI NO₂ observations with CAMS regional fields to assess spatial patterns and air-quality variability.
Calculating and mapping the European AQI from CAMS pollutant data and analysing pollutants with heat maps.
Computing and visualising the global AQI from CAMS pollutants to assess air-quality conditions worldwide.
Processing and visualising CAMS ozone fields to visualise and animate the Antarctic ozone hole.
Access CAMS global atmospheric composition forecasts and view time series as animations.
Create maps of CAMS global atmospheric composition forecast data for multiple parameters.
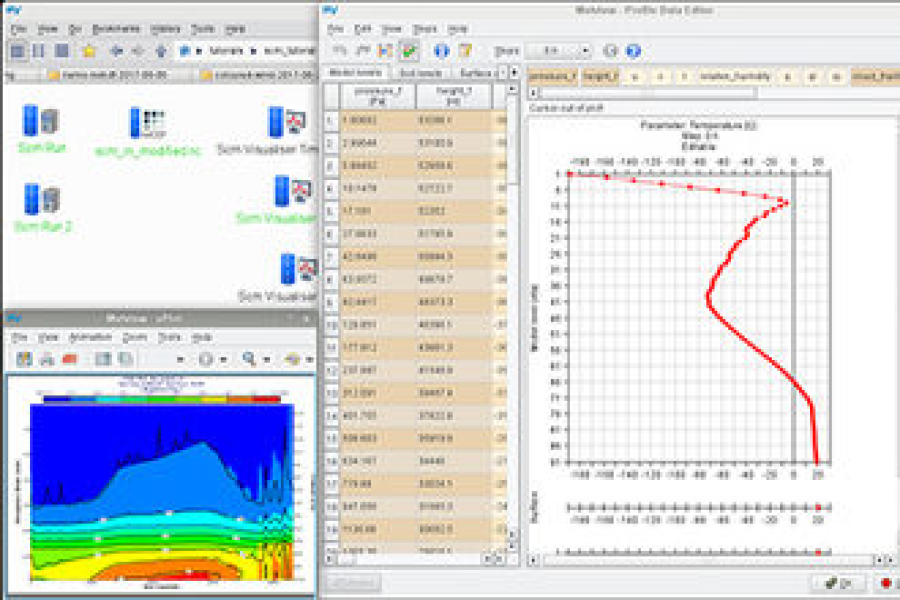
Visualising vertical profiles of species from CAMS data to examine atmospheric layering and profile behaviour.
Downloading, calculating and plotting global CO2 time series using CAMS reanalysis data.
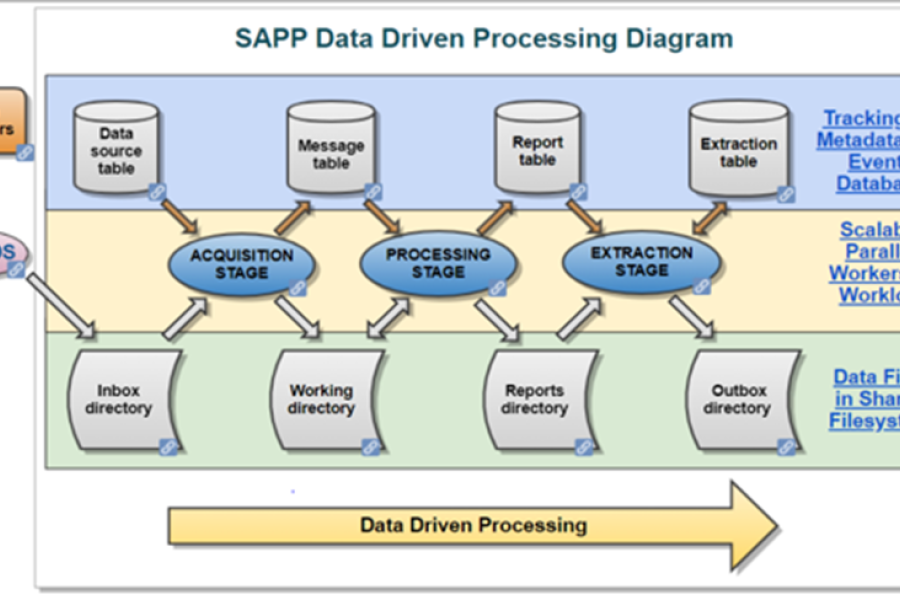
The SAPP system is the ECMWF's operational acquisition and pre-processing system for observations and other input data.
This lesson focuses on ECGATE - ECMWF's server allocated for users' tasks, from submitting jobs to correcting errors.
This lesson provides an overview of Metview's main features to analyse and edit input data for the single-column model.
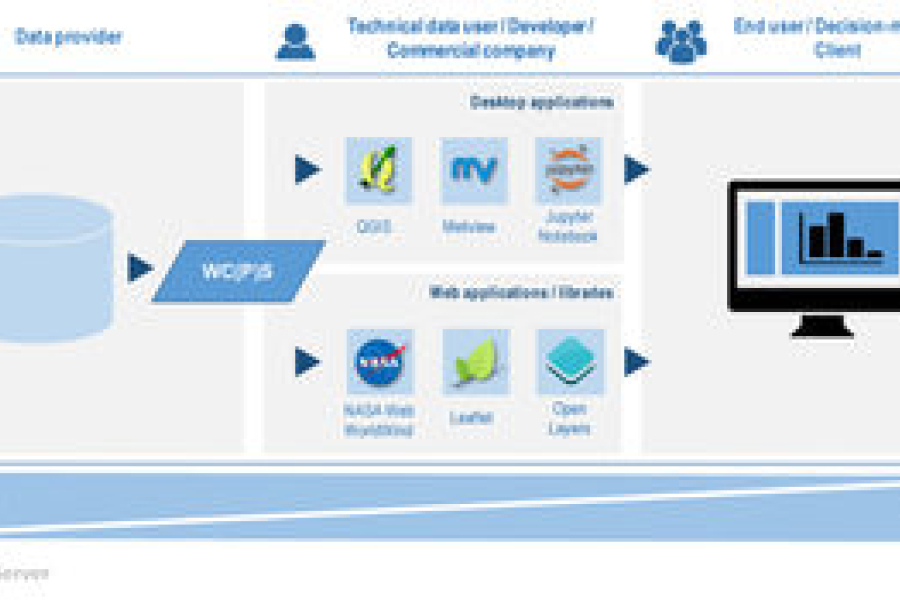
This lesson describes the web services used to visualise geographical data and outlines what OGC and INSPIRE are.