Comparing TROPOMI NO₂ observations with CAMS regional fields to assess spatial patterns and air-quality variability.
Calculating and mapping the European AQI from CAMS pollutant data and analysing pollutants with heat maps.
Computing and visualising the global AQI from CAMS pollutants to assess air-quality conditions worldwide.
Processing and visualising CAMS ozone fields to visualise and animate the Antarctic ozone hole.
Introduction to calculating seasonal forecast anomalies. Visualisation as spatial maps, time series and interactive plot
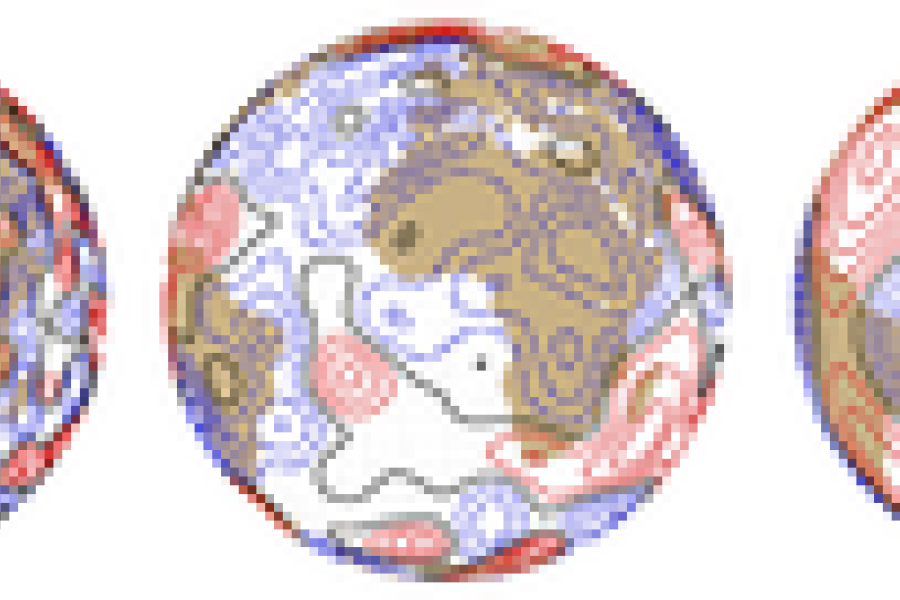
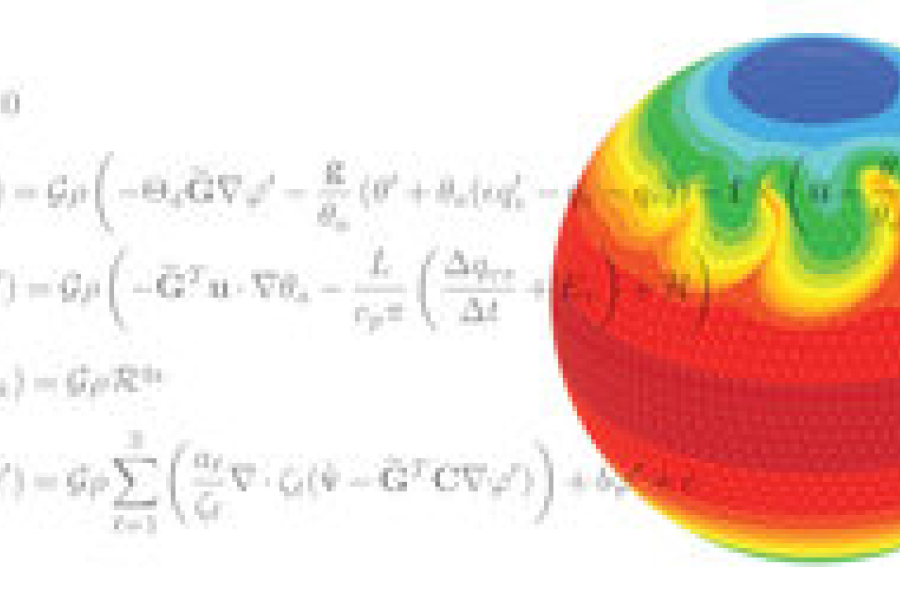
Explore sources of uncertainty in NWP and how this is represented in the IFS using stochastic physics.
This lesson focuses on ECGATE - ECMWF's server allocated for users' tasks, from submitting jobs to correcting errors.
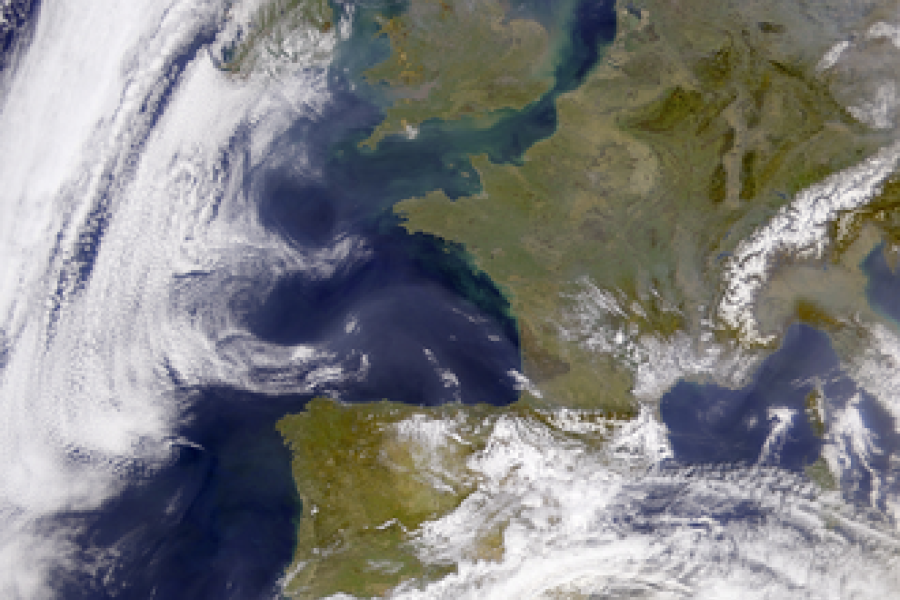
Four case studies exploring the conditions that cause deep convection, considering predictability and forecast errors.
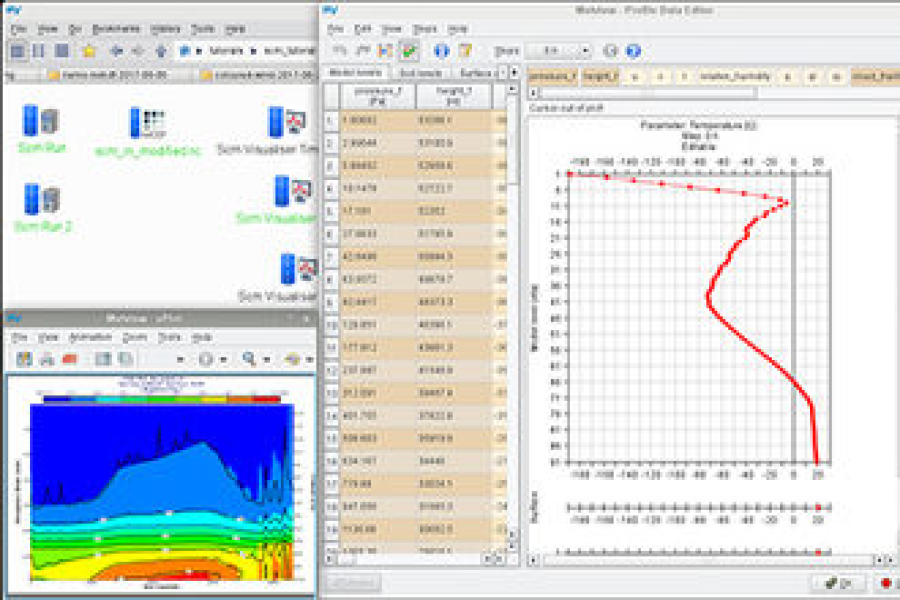
This lesson provides an overview of Metview's main features to analyse and edit input data for the single-column model.
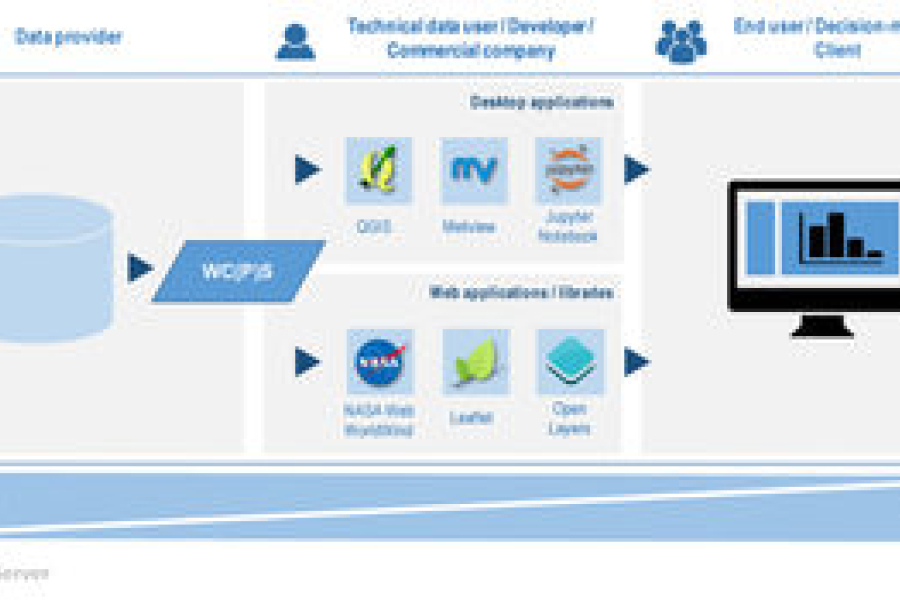
This lesson describes the web services used to visualise geographical data and outlines what OGC and INSPIRE are.
This lesson is focused on how to gain flexibility and control when handling GRIB data using advanced ecCodes tools.
How SCM is used to investigate the physical processes of a global model in isolation, its applications and limitations.