This lesson is focused on how to gain flexibility and control when handling GRIB data using advanced ecCodes tools.
How SCM is used to investigate the physical processes of a global model in isolation, its applications and limitations.
ecCodes is an application programming interface developed by ECMWF to decode and encode in WMO GRIB and BUFR formats.
The Meteorological Archival and Retrieval System (MARS) enables users to access and retrieve ECMWF’s historical data.
The Meteorological Archival and Retrieval System (MARS) enables access to ECMWF data. Explore its computing capability
An introduction into Climate Services, and a seven step approach to develop a case study, illustrated with a practical example.
ecCodes is an application programming interface developed by ECMWF to decode and encode in WMO GRIB format.
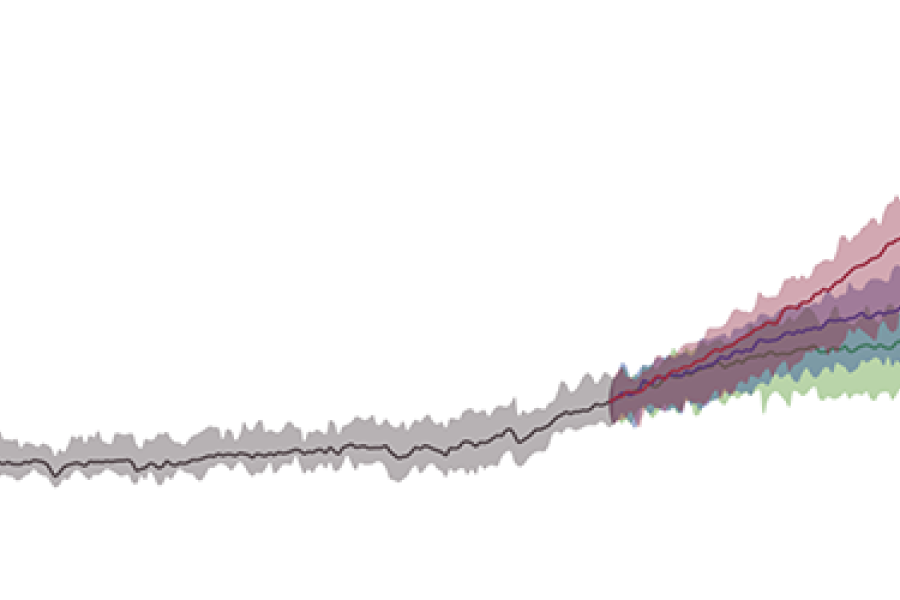
This lesson teaches about sources of uncertainty in climate projections, what robust signals are, and when we can be confident in a change.
This lesson teaches about downscaling and bias correction methods. An exercise for bias correction is included.
This lesson covers how climate change impacts the agriculture sector. Responses of different crop types to climate change is explained. Adaptation measures are introduced and how CDS data can be used ...
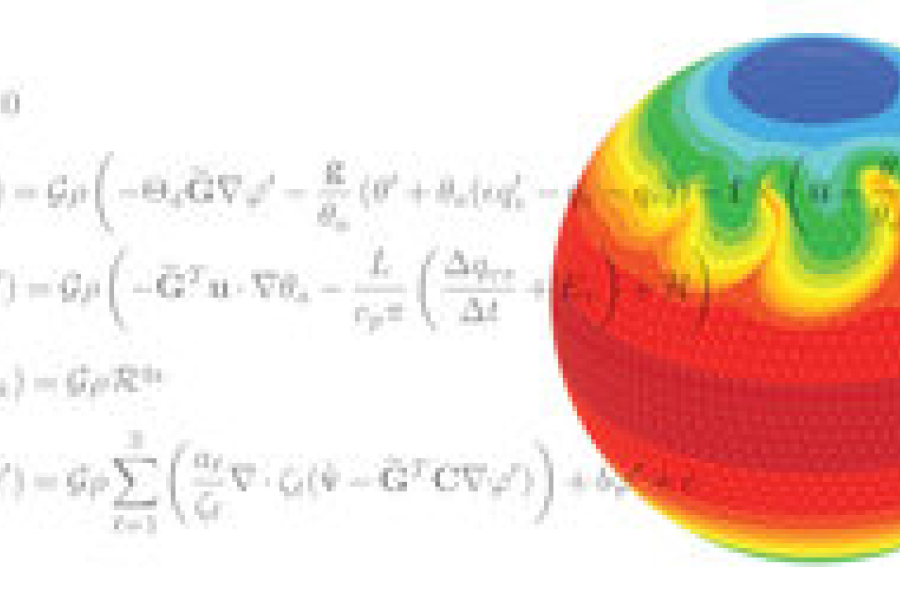
Uncover how climate models work and how they can be evaluated. Differences between climate projections, predictions and scenarios are explained.
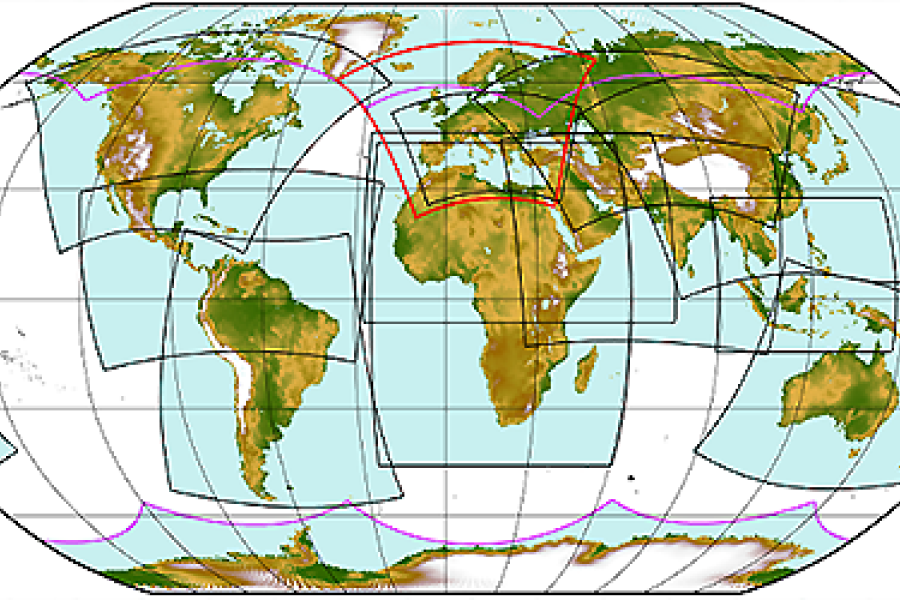
About climate projections, differences between climate models, and how to choose from climate projection data.