Datasets

These charts show indices which indicate the susceptibility of the troposphere to support free convection. Typical values of the different indices depend on location and...
Interval/period: N/A

This diagram shows time evolution of a Madden-Julian Oscillation (MJO) index. ...
Interval/period: N/A

This chart shows probability information regarding lightning flash density derived from the ...
Interval/period: N/A

This chart shows probability information regarding CAPE shear derived from the ECMWF ensemble ...
Interval/period: N/A

This chart shows probability information regarding MUCAPE derived from the ECMWF ensemble (ENS) ...
Interval/period: N/A

These charts show areas where anomalous CAPE are likely to occur.
Interval/period: N/A

These charts show areas where anomalous CAPE Shear are likely to occur.
Interval/period: N/A
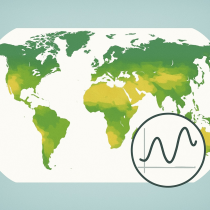
Fifth Generation of the European Centre for Medium-Range Weather Forecasts (ECMWF) Reanalysis (ERA5).
Produced by replaying only the land component of the ECMWF ERA5 climate reanalysis, it benefits from the same physical data-assimilation framework but runs offline at
higher spatial detail (9 km grid) to deliver richer land-surface information.
Interval/period: Sun, 01/01/1950 - Thu, 12/31/2026
Interval/period: Sun, 01/01/1950 - Sat, 05/02/2026
Interval/period: Sun, 01/01/1950 - Wed, 04/01/2026
Interval/period: Sun, 01/01/1950 - Sat, 05/02/2026

MUCAPE (Most Unstable Convective Available Potential Energy) is an indicator of atmospheric instability (the susceptibility of the troposphere to support free convection) and...
Interval/period: N/A