Datasets
This product shows ENS meteograms from next model version of IFS cycle 50R1 that is planned to be ...
Interval/period: N/A
**This product shows ENS meteograms from next model version of IFS cycle 50R1 that is planned ...**
Interval/period: N/A
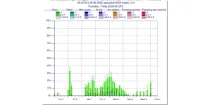
**Next IFS version (cycle 50r1)**. This product shows the probability of visibility (%) in 2 ...
Interval/period: N/A
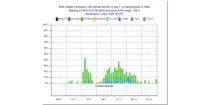
(Next IFS version - CY50R1) Probability of precipitation type (%) in precipitation rate categories ...
Interval/period: N/A
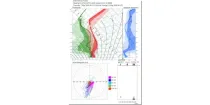
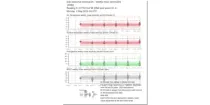
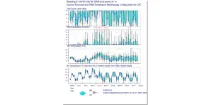
(New IFS cycle 50R1) The Vertical Profiles display the vertical structure of the forecast model atmosphere in a familiar user friendly way. The vertical structure of temperatures (red) dewpoints (green) and dewpoint depressions (blue) from each ENS member ...
Interval/period: N/A
Uncoloured areas (relative humidity < 65%) are likely to be free of cloud. Coloured areas (relative humidity > 65%) show where moisture is likely to be available for cloud development...
Interval/period: N/A
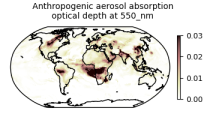
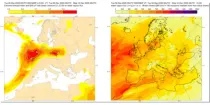
This dataset provides aerosol optical depths and aerosol-radiation radiative effects for four different aerosol origins: anthropogenic, mineral dust, marine, and land-based fine-mode natural aerosol. The latter mostly consists of biogenic aerosols.
Interval/period: N/A
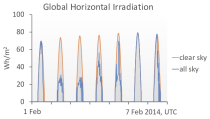
The CAMS solar radiation services provide historical values (2004 to present) of global (GHI), direct (BHI) and diffuse (DHI) solar irradiation, as well as direct normal irradiation (BNI). The aim is to fulfil the needs of European and national policy development and the requirements of both commercial and public downstream services, e.g. for planning, monitoring, efficiency improvements and the integration of solar energy systems into energy supply grids.
Interval/period: N/A
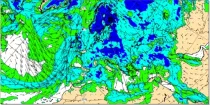
These charts aim to provide pointers to areas where anomalous values of water vapour flux are likely to occur based on the ECMWF en ...
Interval/period: N/A