Datasets

These charts show indices which indicate the susceptibility of the troposphere to support free convection. Typical values of the different indices depend on location and...
Interval/period: N/A

This diagram shows time evolution of a Madden-Julian Oscillation (MJO) index. ...
Interval/period: N/A

This chart shows probability information regarding lightning flash density derived from the ...
Interval/period: N/A

This chart shows probability information regarding CAPE shear derived from the ECMWF ensemble ...
Interval/period: N/A

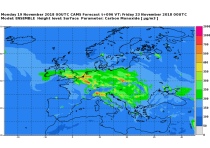
This chart shows probability information regarding MUCAPE derived from the ECMWF ensemble (ENS) ...
Interval/period: N/A
This dataset provides daily air quality analyses and forecasts for Europe.
Interval/period: N/A
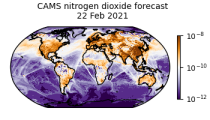
CAMS produces global forecasts for atmospheric composition twice a day. The forecasts consist of more than 50 chemical species (e.g. ozone, nitrogen dioxide, carbon monoxide) and seven different types of aerosol (desert dust, sea salt, organic matter, black carbon, sulphate, nitrate and ammonium aerosol). In addition, several meteorological variables are available as well.
Interval/period: N/A

ERA-Interim/Land is a global reanalysis of land-surface parameters from 1979-2010 at 80 km spatial resolution. It was produced with a recent version of the HTESSEL land-surface model using atmospheric forcing from ERA-Interim, with precipitation adjustments based on GPCP v2.1.
Interval/period: N/A

These charts show areas where anomalous CAPE are likely to occur.
Interval/period: N/A

These charts show areas where anomalous CAPE Shear are likely to occur.
Interval/period: N/A

MUCAPE (Most Unstable Convective Available Potential Energy) is an indicator of atmospheric instability (the susceptibility of the troposphere to support free convection) and...
Interval/period: N/A