Datasets

These charts show indices which indicate the susceptibility of the troposphere to support free convection. Typical values of the different indices depend on location and...
Interval/period: N/A
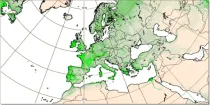
The leaf area index determines the degree of evapotranspiration. The index varies in a climatological way in the model, month by month (and so will not change in a different way if there is anomalous weather)...
Interval/period: N/A

This diagram shows time evolution of a Madden-Julian Oscillation (MJO) index. ...
Interval/period: N/A

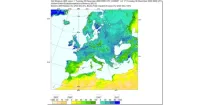
This chart shows probability information regarding lightning flash density derived from the ...
Interval/period: N/A

This chart shows probability information regarding CAPE shear derived from the ECMWF ensemble ...
Interval/period: N/A

This chart shows probability information regarding MUCAPE derived from the ECMWF ensemble (ENS) ...
Interval/period: N/A
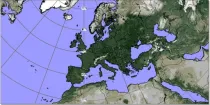
Lower values mean that more radiation is absorbed at the earth's surface while higher values mean more is reflected back to space. Albedo depends on the characteristics of the underlying surface and...
Interval/period: N/A

These charts show areas where anomalous CAPE are likely to occur.
Interval/period: N/A

These charts show areas where anomalous CAPE Shear are likely to occur.
Interval/period: N/A

MUCAPE (Most Unstable Convective Available Potential Energy) is an indicator of atmospheric instability (the susceptibility of the troposphere to support free convection) and...
Interval/period: N/A

The nextGEMS data is aligned with the Climate Change Adaptation Digital Twin. The DestinE Digital Twin for Climate Change Adaptation (Climate DT) supports adaptation activities by providing innovative climate information on multi-decadal timescales, globally, at scales at which many impacts of climate change are observed.
Interval/period: N/A
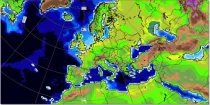
The height of topography above mean sea level and the depth of the sea for each model grid box ...
Interval/period: N/A
Soil moisture handling in the model is complex, and could be highlighted in many ways. Here a 'relativistic' approach is used for display, showing not absolute values, but instead...
Interval/period: N/A