Datasets
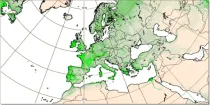
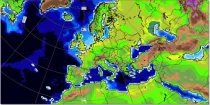
The leaf area index determines the degree of evapotranspiration. The index varies in a climatological way in the model, month by month (and so will not change in a different way if there is anomalous weather)...
Interval/period: N/A
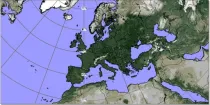
Lower values mean that more radiation is absorbed at the earth's surface while higher values mean more is reflected back to space. Albedo depends on the characteristics of the underlying surface and...
Interval/period: N/A
Interval/period: Sat, 09/01/1984 - Sat, 01/31/2026
Interval/period: Sat, 09/01/1984 - Sat, 01/31/2026
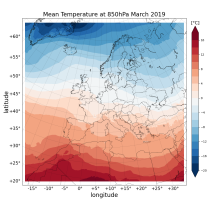
Interval/period: Sat, 09/01/1984 - Sat, 01/31/2026
The height of topography above mean sea level and the depth of the sea for each model grid box ...
Interval/period: N/A
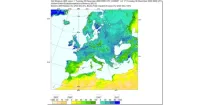
Soil moisture handling in the model is complex, and could be highlighted in many ways. Here a 'relativistic' approach is used for display, showing not absolute values, but instead...
Interval/period: N/A