Datasets

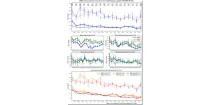
This chart provides information on the verification of forecasts of Accumulated Cyclone Energy ...
Interval/period: N/A

The ECMWF seasonal forecasts (SEAS5) are produced every month with a 51-member ensemble at a ...
Interval/period: N/A
The diagram shows mean errors in position and intensity of tropical cyclones for HRES and ENS. ...
Interval/period: N/A

The ECMWF seasonal forecasts (SEAS5) are produced every month with a 51-member ensemble at a ...
Interval/period: N/A
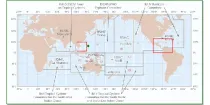
These charts provide information on current Tropical Cyclone activity. Select the ...
Interval/period: N/A
This chart shows the potential for tropical cyclone activity at different time ranges during the ...
Interval/period: N/A

The ECMWF seasonal forecasts (SEAS5) are produced every month with a 51-member ensemble at a ...
Interval/period: N/A

The ECMWF seasonal forecasts (SEAS5) are produced every month with a 51-member ensemble at a ...
Interval/period: N/A

The charts show mean frequency and accumulated cyclone energy of tropical storm activity. ...
Interval/period: N/A

This chart provides information on the verification of forecasts of the expected number of ...
Interval/period: N/A

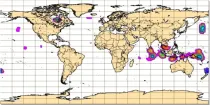
The charts show the evolution of existing and potential tropical cyclone activity. ...
Interval/period: N/A

The ECMWF seasonal forecasts (SEAS5) are produced every month with a 51-member ensemble at a ...
Interval/period: N/A

This chart provides information on the verification of forecasts of the number of tropical ...
Interval/period: N/A

An eddy-permitting ocean reanalysis spanning the period 1979–2012. Includes increased horizontal and vertical resolution, an prognostic sea-ice component, new versions of the ocean and data assimilation system, revised surface fluxes, new version and treatment of satellite sea surface height data, and assimilation of sea-ice concentration, among others.
Interval/period: N/A
Uses a sophisticated data assimilation methodology which includes a model bias correction. The ocean model used is forced by atmospheric daily surface fluxes, relaxed to SST and bias corrected.
Interval/period: N/A