Datasets

This chart provides information on the verification of forecasts of Accumulated Cyclone Energy ...
Interval/period: N/A

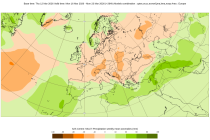
The ECMWF seasonal forecasts (SEAS5) are produced every month with a 51-member ensemble at a ...
Interval/period: N/A
Interval/period: Sun, 10/01/1978 - Mon, 09/29/2025
Interval/period: Tue, 01/01/1991 - Thu, 12/31/2020
Interval/period: Wed, 10/25/1978 - Wed, 09/24/2025
Interval/period: Mon, 01/01/1979 - Tue, 09/30/2025
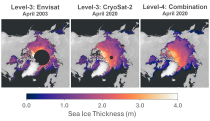
Interval/period: Tue, 10/01/2002 - Sat, 04/12/2025
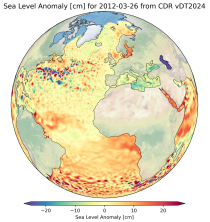
Interval/period: Fri, 01/01/1993 - Sun, 12/31/2023
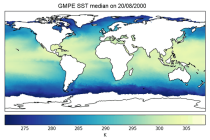
Interval/period: Tue, 09/01/1981 - Sat, 12/31/2016
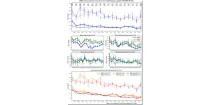
The diagram shows mean errors in position and intensity of tropical cyclones for HRES and ENS. ...
Interval/period: N/A
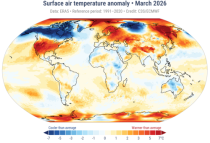
Interval/period: Mon, 01/01/1979 - Wed, 04/01/2026

The ECMWF seasonal forecasts (SEAS5) are produced every month with a 51-member ensemble at a ...
Interval/period: N/A
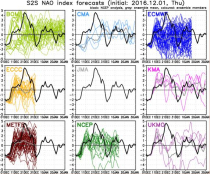
S2S project behind the dataset started in 2013 as a joint initiative of the World Weather Research Programme (WWRP) and the World Climate Research Programme (WCRP).
The goal of S2S project was to improve sub-seasonal forecast skill through combining multiple forecasting systems, enable multi-model evaluations and enhance knowledge sharing between operational centres.
Interval/period: Thu, 01/01/2015 - Wed, 05/06/2026
S2S project behind the dataset started in 2013 as a joint initiative of the World Weather Research Programme (WWRP) and the World Climate Research Programme (WCRP).
The goal of S2S project was to improve sub-seasonal forecast skill through combining multiple forecasting systems, enable multi-model evaluations and enhance knowledge sharing between operational centres.
Interval/period: Tue, 03/01/2011 - Tue, 06/09/2026
These charts provide information on current Tropical Cyclone activity. Select the ...
Interval/period: N/A
This chart shows the potential for tropical cyclone activity at different time ranges during the ...
Interval/period: N/A

The ECMWF seasonal forecasts (SEAS5) are produced every month with a 51-member ensemble at a ...
Interval/period: N/A

The ECMWF seasonal forecasts (SEAS5) are produced every month with a 51-member ensemble at a ...
Interval/period: N/A

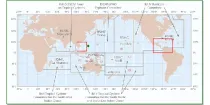
The charts show mean frequency and accumulated cyclone energy of tropical storm activity. ...
Interval/period: N/A

This chart provides information on the verification of forecasts of the expected number of ...
Interval/period: N/A

The charts show the evolution of existing and potential tropical cyclone activity. ...
Interval/period: N/A
This dataset provides daily air quality analyses and forecasts for Europe.
Interval/period: N/A
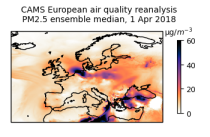
This dataset provides annual air quality reanalyses for Europe based on both unvalidated (interim) and validated observations.
Interval/period: N/A
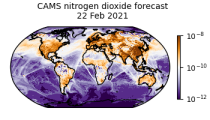
CAMS produces global forecasts for atmospheric composition twice a day. The forecasts consist of more than 50 chemical species (e.g. ozone, nitrogen dioxide, carbon monoxide) and seven different types of aerosol (desert dust, sea salt, organic matter, black carbon, sulphate, nitrate and ammonium aerosol). In addition, several meteorological variables are available as well.
Interval/period: N/A
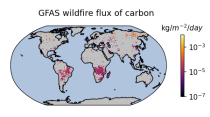
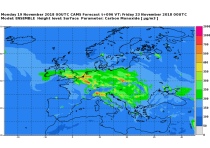
Emissions of atmospheric pollutants from biomass burning and vegetation fires are key drivers of the evolution of atmospheric composition, with a high degree of spatial and temporal variability, and an accurate representation of them in models is essential.
Interval/period: N/A