Datasets

This chart provides information on the verification of forecasts of Accumulated Cyclone Energy ...
Interval/period: N/A

The ECMWF seasonal forecasts (SEAS5) are produced every month with a 51-member ensemble at a ...
Interval/period: N/A
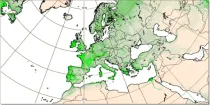
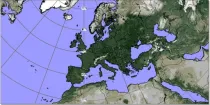
The leaf area index determines the degree of evapotranspiration. The index varies in a climatological way in the model, month by month (and so will not change in a different way if there is anomalous weather)...
Interval/period: N/A
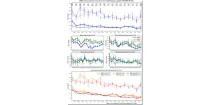
The diagram shows mean errors in position and intensity of tropical cyclones for HRES and ENS. ...
Interval/period: N/A

The ECMWF seasonal forecasts (SEAS5) are produced every month with a 51-member ensemble at a ...
Interval/period: N/A
These charts provide information on current Tropical Cyclone activity. Select the ...
Interval/period: N/A
This chart shows the potential for tropical cyclone activity at different time ranges during the ...
Interval/period: N/A

The ECMWF seasonal forecasts (SEAS5) are produced every month with a 51-member ensemble at a ...
Interval/period: N/A

The ECMWF seasonal forecasts (SEAS5) are produced every month with a 51-member ensemble at a ...
Interval/period: N/A

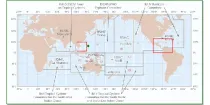
The charts show mean frequency and accumulated cyclone energy of tropical storm activity. ...
Interval/period: N/A

This chart provides information on the verification of forecasts of the expected number of ...
Interval/period: N/A

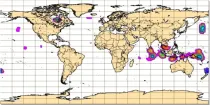
The charts show the evolution of existing and potential tropical cyclone activity. ...
Interval/period: N/A
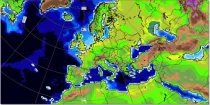
Lower values mean that more radiation is absorbed at the earth's surface while higher values mean more is reflected back to space. Albedo depends on the characteristics of the underlying surface and...
Interval/period: N/A

The ECMWF seasonal forecasts (SEAS5) are produced every month with a 51-member ensemble at a ...
Interval/period: N/A

This chart provides information on the verification of forecasts of the number of tropical ...
Interval/period: N/A
The height of topography above mean sea level and the depth of the sea for each model grid box ...
Interval/period: N/A
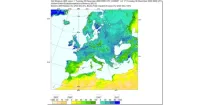
Soil moisture handling in the model is complex, and could be highlighted in many ways. Here a 'relativistic' approach is used for display, showing not absolute values, but instead...
Interval/period: N/A