Datasets

This chart provides information on the verification of forecasts of Accumulated Cyclone Energy ...
Interval/period: N/A

The ECMWF seasonal forecasts (SEAS5) are produced every month with a 51-member ensemble at a ...
Interval/period: N/A

These charts show indices which indicate the susceptibility of the troposphere to support free convection. Typical values of the different indices depend on location and...
Interval/period: N/A

This diagram shows time evolution of a Madden-Julian Oscillation (MJO) index. ...
Interval/period: N/A

Mean wave period is the spectrally averaged period of the waves. Wave periods are shown in seconds using colour shading – click on the middle icon to the bottom right for the scale...
Interval/period: N/A
Interval/period: Sun, 10/01/1978 - Mon, 09/29/2025
Interval/period: Tue, 01/01/1991 - Thu, 12/31/2020
Interval/period: Wed, 10/25/1978 - Wed, 09/24/2025
Interval/period: Mon, 01/01/1979 - Tue, 09/30/2025
Interval/period: Tue, 10/01/2002 - Sat, 04/12/2025
Interval/period: Fri, 01/01/1993 - Sun, 12/31/2023
Interval/period: Tue, 09/01/1981 - Sat, 12/31/2016
Interval/period: Mon, 01/01/1979 - Wed, 04/01/2026

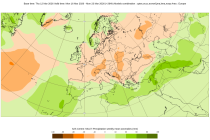
This chart shows probability information regarding lightning flash density derived from the ...
Interval/period: N/A

This chart shows probability information regarding mean wave period derived from the ECMWF ...
Interval/period: N/A

This chart shows probability information regarding significant wave height derived from the ...
Interval/period: N/A

These charts show the probability of various mean periods of ocean waves 10-15 days ahead. The ...
Interval/period: N/A

The ECMWF seasonal forecasts (SEAS5) are produced every month with a 51-member ensemble at a ...
Interval/period: N/A

Mean windsea wave direction is the spectrally averaged direction of propagation of the windsea waves (weighted by wave height). Arrow length is proportional to the speed of wave propagation...
Interval/period: N/A

Significant windsea wave height can be shown to correspond to the average wave height of the top one-third highest windsea waves. Wave heights are shown in metres using colour shading...
Interval/period: N/A
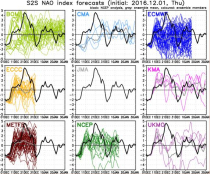
S2S project behind the dataset started in 2013 as a joint initiative of the World Weather Research Programme (WWRP) and the World Climate Research Programme (WCRP).
The goal of S2S project was to improve sub-seasonal forecast skill through combining multiple forecasting systems, enable multi-model evaluations and enhance knowledge sharing between operational centres.
Interval/period: Thu, 01/01/2015 - Wed, 05/06/2026
S2S project behind the dataset started in 2013 as a joint initiative of the World Weather Research Programme (WWRP) and the World Climate Research Programme (WCRP).
The goal of S2S project was to improve sub-seasonal forecast skill through combining multiple forecasting systems, enable multi-model evaluations and enhance knowledge sharing between operational centres.
Interval/period: Tue, 03/01/2011 - Tue, 06/09/2026

These charts show probability of various heights of significant waves 10-15 days ahead. The ...
Interval/period: N/A

This chart shows probability information regarding CAPE shear derived from the ECMWF ensemble ...
Interval/period: N/A

This chart shows probability information regarding MUCAPE derived from the ECMWF ensemble (ENS) ...
Interval/period: N/A