Datasets
Interval/period: Fri, 01/01/2021 - Sun, 05/10/2026
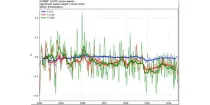
These diagrams show verification scores for significant wave height and 10 m wind for three ...
Interval/period: N/A
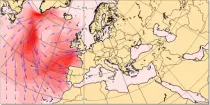
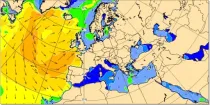
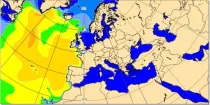
These charts show the the wave energy flux (in kW m⁻¹) calculated as the integral, over all forecast wave frequencies and wave directions, of the product of the wave group speed and the two-dimensional energy wave spectrum...
Interval/period: N/A
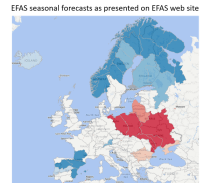
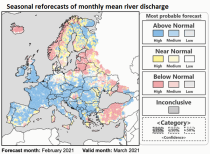
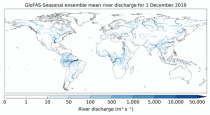
River discharge
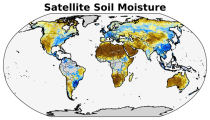
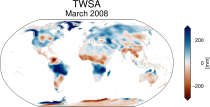
Volumetric soil moisture
Snow water equivalent
Soil wetness index (root zone)
Runoff water equivalent (surface plus subsurface)
Interval/period: Sun, 11/01/2020 - Wed, 04/01/2026
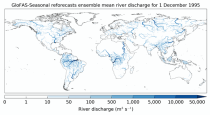
River discharge
Soil wetness index (root zone)
Snow water equivalent
Runoff water equivalent (surface plus subsurface)
Interval/period: Tue, 12/01/2020 - Wed, 04/01/2026
River discharge
Volumetric soil moisture
Snow water equivalent
Soil wetness index (root zone)
Runoff water equivalent (surface plus subsurface)
Interval/period: Fri, 01/01/1999 - Sun, 05/10/2026
Interval/period: Thu, 01/01/1981 - Sat, 07/01/2023
At any location over the oceans, there is a spectrum of waves which describes how much wave energy is present for given wave frequencies and direction of propagation...
Interval/period: N/A
Significant wave height can be shown to correspond to the average wave height of the top one-third highest waves. The wave period of windsea is generally <10s,...
Interval/period: N/A
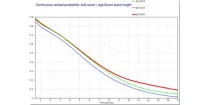
These diagrams compare Continuous Ranked Probability Skill Scores (CRPSS) of ECMWF with ...
Interval/period: N/A
Interval/period: Wed, 11/01/1978 - Mon, 04/20/2026
Interval/period: Thu, 04/04/2002 - Tue, 04/01/2025