Datasets

This chart provides information on the verification of forecasts of Accumulated Cyclone Energy ...
Interval/period: N/A

The ECMWF seasonal forecasts (SEAS5) are produced every month with a 51-member ensemble at a ...
Interval/period: N/A
Interval/period: Thu, 06/01/1995 - Sat, 05/09/2026
Interval/period: Wed, 01/01/1992 - Sat, 05/09/2026

Mean wave period is the spectrally averaged period of the waves. Wave periods are shown in seconds using colour shading – click on the middle icon to the bottom right for the scale...
Interval/period: N/A
Interval/period: Mon, 01/01/1979 - Wed, 04/01/2026
Interval/period: Sun, 01/01/1950 - Tue, 12/31/2019
Interval/period: Wed, 01/01/1986 - Sun, 12/31/2023
Interval/period: Wed, 01/01/1986 - Sun, 12/31/2023
Interval/period: Mon, 01/01/1979 - Mon, 09/30/2024
Interval/period: Sat, 01/01/2000 - Sun, 12/31/2017

This chart shows probability information regarding mean wave period derived from the ECMWF ...
Interval/period: N/A

This chart shows probability information regarding significant wave height derived from the ...
Interval/period: N/A

These charts show the probability of various mean periods of ocean waves 10-15 days ahead. The ...
Interval/period: N/A

The ECMWF seasonal forecasts (SEAS5) are produced every month with a 51-member ensemble at a ...
Interval/period: N/A
combined with observations using the UERRA-HARMONIE system and MESCAN-SURFEX system.
UERRA-HARMONIE is a 3-dimensional data assimilation system, whereas
MESCAN-SURFEX is a complementary surface analysis system. In general, the
assimilation systems are able to estimate biases between observations and to
sift good-quality data from poor data. The laws of physics allow for estimates
Interval/period: Thu, 10/18/2018 - Wed, 07/31/2019
The DestinE Digital Twin for Weather-Induced Extremes (Extremes DT) supports responding and adapting to extreme events in a changing world by providing a capability to produce tailored simulations and address what-if scenarios related to extreme events in a past, present and future climate, complementing existing capabilities at national and European level.
Interval/period: N/A

Mean windsea wave direction is the spectrally averaged direction of propagation of the windsea waves (weighted by wave height). Arrow length is proportional to the speed of wave propagation...
Interval/period: N/A

Significant windsea wave height can be shown to correspond to the average wave height of the top one-third highest windsea waves. Wave heights are shown in metres using colour shading...
Interval/period: N/A
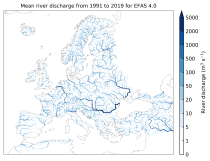
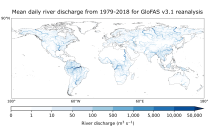
River discharge
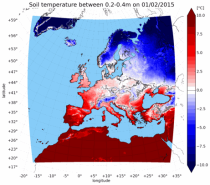
Volumetric soil moisture
Snow water equivalent
Soil wetness index (root zone)
Runoff water equivalent (surface plus subsurface)
Interval/period: Thu, 10/11/2018 - Mon, 04/06/2026

This dataset provides gridded modelled hydrological time series forced with medium-range meteorological forecasts. The data is a consistent representation of the most important hydrological variables across the European Flood Awareness System (EFAS) domain. The temporal resolution is sub-daily high-resolution and ensemble forecasts of:
River discharge
Soil moisture for three soil layers
Snow water equivalent
Interval/period: N/A
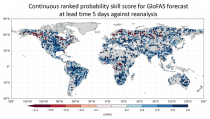
River discharge
Soil wetness index (root zone)
Snow water equivalent
Runoff water equivalent (surface plus subsurface)
Interval/period: Tue, 11/05/2019 - Thu, 05/07/2026

River discharge
Volumetric soil moisture
Snow water equivalent
Soil wetness index (root zone)
Runoff water equivalent (surface plus subsurface)
Interval/period: Tue, 01/01/1991 - Tue, 05/05/2026
River discharge
Soil wetness index (root zone)
Snow water equivalent
Runoff water equivalent (surface plus subsurface)
Interval/period: Mon, 01/01/1979 - Tue, 05/05/2026

These charts show probability of various heights of significant waves 10-15 days ahead. The ...
Interval/period: N/A