Datasets

The ECMWF seasonal forecasts (SEAS5) are produced every month with a 51-member ensemble at a ...
Interval/period: N/A

The charts show mean frequency and accumulated cyclone energy of tropical storm activity. ...
Interval/period: N/A

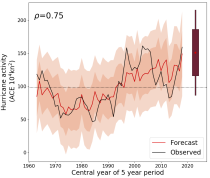
This chart provides information on the verification of forecasts of the expected number of ...
Interval/period: N/A

The charts show the evolution of existing and potential tropical cyclone activity. ...
Interval/period: N/A
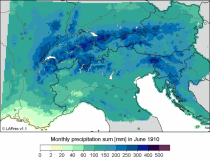
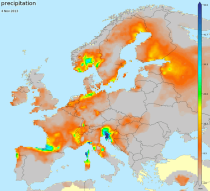
LAPrec1871 starts in 1871 and is based on data from 85 input series;
LAPrec1901 starts in 1901 and is based on data from 165 input series.
Interval/period: Sun, 01/01/1871 - Sat, 05/09/2026
These daily and monthly data are pre-calculated and have the following types depending on the variables: daily and monthly averages, extremes and totals.
Interval/period: Sat, 09/01/1990 - Sat, 02/28/2026
Interval/period: Sat, 09/01/1984 - Sat, 01/31/2026
Interval/period: Sat, 09/01/1984 - Thu, 07/31/2025
Interval/period: Mon, 01/01/1979 - Sun, 03/01/2026
Interval/period: N/A
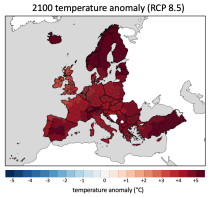
Interval/period: Sun, 01/01/1950 - Wed, 12/01/2100
Interval/period: Mon, 01/01/1940 - Fri, 12/31/2100
Interval/period: Sun, 01/01/1860 - Mon, 12/31/2300
Interval/period: Wed, 01/01/1800 - Fri, 12/31/2100
Interval/period: Sun, 01/01/1860 - Mon, 12/31/2300
Interval/period: Sun, 01/01/1860 - Mon, 12/31/2300
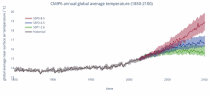
CMIP6 data underpins the Intergovernmental Panel on Climate Change 6th Assessment Report. The use of these data is mostly aimed at:
addressing outstanding scientific questions that arose as part of the IPCC reporting process;
improving the understanding of the climate system;
Interval/period: Sun, 01/01/1860 - Mon, 12/31/2300
Interval/period: Sun, 01/01/1860 - Mon, 12/31/2300

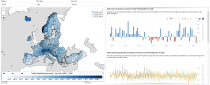
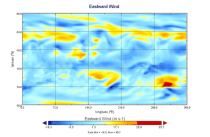
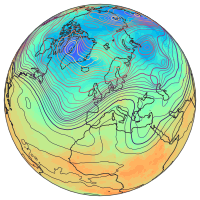
This chart shows the probability that both the wind at 10 m above the earth's surface is ...
Interval/period: N/A
Interval/period: Sat, 01/01/1949 - Sat, 05/09/2026
Interval/period: Sun, 01/01/1950 - Fri, 12/31/2100
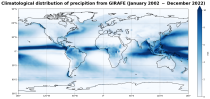
Interval/period: Tue, 01/01/2002 - Sat, 12/31/2022
Interval/period: Sun, 01/01/1950 - Sat, 05/09/2026
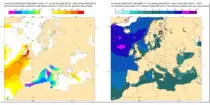
These charts show areas where anomalous significant wave heights are likely to occur. These charts are based on the ECMWF ense ...
Interval/period: N/A
Data is available from 1940 onwards.
ERA5 replaces the ERA-Interim reanalysis.
Interval/period: Mon, 01/01/1940 - Sat, 05/02/2026