Datasets
This product shows ENS meteograms from next model version of IFS cycle 50R1 that is planned to be ...
Interval/period: N/A
**This product shows ENS meteograms from next model version of IFS cycle 50R1 that is planned ...**
Interval/period: N/A
**Next IFS version (cycle 50r1)**. This product shows the probability of visibility (%) in 2 ...
Interval/period: N/A
(Next IFS version - CY50R1) Probability of precipitation type (%) in precipitation rate categories ...
Interval/period: N/A
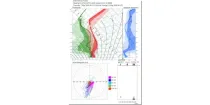
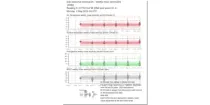
(New IFS cycle 50R1) The Vertical Profiles display the vertical structure of the forecast model atmosphere in a familiar user friendly way. The vertical structure of temperatures (red) dewpoints (green) and dewpoint depressions (blue) from each ENS member ...
Interval/period: N/A

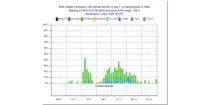
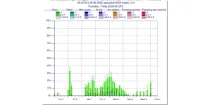
This chart provides information on the verification of forecasts of Accumulated Cyclone Energy ...
Interval/period: N/A

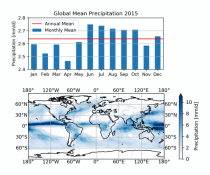
The ECMWF seasonal forecasts (SEAS5) are produced every month with a 51-member ensemble at a ...
Interval/period: N/A
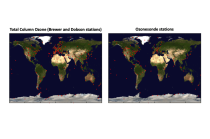
The total ozone estimates are based on solar UV radiation measurements made by ground-based spectrophotometers (Dobson or Brewer type spectrophotometers).
The vertical profiles of ozone concentration are estimated primarily using ozonesonde observations.
Data are available for 159 Dobson stations, 109 Brewer stations and 135 ozonesondes stations.
Interval/period: Tue, 01/01/1924 - Sat, 05/09/2026
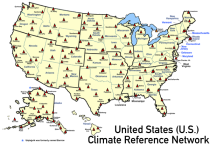
United States Climate Reference Network (USCRN) stations.
There are over 130 USCRN stations over the conterminous United States (U.S.), Alaska, and Hawaii.
The USCRN stations are managed and maintained by the U.S. National Oceanic and Atmospheric Administration (NOAA).
The USCRN observations include air temperature, humidity, wind speed, precipitation, solar radiation,
Interval/period: Sun, 01/01/2006 - Sat, 05/09/2026

Mean wave period is the spectrally averaged period of the waves. Wave periods are shown in seconds using colour shading – click on the middle icon to the bottom right for the scale...
Interval/period: N/A
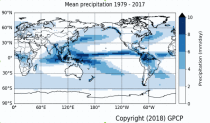
Interval/period: Mon, 01/01/1979 - Wed, 04/01/2026
The data are bias adjusted using the Distribution Based Scaling (DBS) method versus the global reference dataset HydroGFD2.0, both bias adjustment method and global reference dataset developed by the Swedish Meteorological and Hydrological Institute (SMHI).
The DBS method is a parametric quantile-mapping variant.
Interval/period: Thu, 10/12/2000 - Thu, 10/18/2018
Interval/period: Wed, 01/01/1986 - Sun, 12/31/2023
Interval/period: Wed, 01/01/1986 - Sun, 12/31/2023
Interval/period: Mon, 01/01/1979 - Mon, 09/30/2024
Interval/period: Sat, 01/01/2000 - Sun, 12/31/2017

This chart shows probability information regarding mean wave period derived from the ECMWF ...
Interval/period: N/A

This chart shows probability information regarding significant wave height derived from the ...
Interval/period: N/A

These charts show the probability of various mean periods of ocean waves 10-15 days ahead. The ...
Interval/period: N/A

The ECMWF seasonal forecasts (SEAS5) are produced every month with a 51-member ensemble at a ...
Interval/period: N/A

Mean windsea wave direction is the spectrally averaged direction of propagation of the windsea waves (weighted by wave height). Arrow length is proportional to the speed of wave propagation...
Interval/period: N/A

Significant windsea wave height can be shown to correspond to the average wave height of the top one-third highest windsea waves. Wave heights are shown in metres using colour shading...
Interval/period: N/A
Interval/period: Thu, 02/01/1940 - Fri, 01/23/2026
Interval/period: Sat, 03/01/1986 - Wed, 11/30/2011
S2S project behind the dataset started in 2013 as a joint initiative of the World Weather Research Programme (WWRP) and the World Climate Research Programme (WCRP).
The goal of S2S project was to improve sub-seasonal forecast skill through combining multiple forecasting systems, enable multi-model evaluations and enhance knowledge sharing between operational centres.
Interval/period: Thu, 01/01/2015 - Wed, 05/06/2026