Datasets

This chart provides information on the verification of forecasts of Accumulated Cyclone Energy ...
Interval/period: N/A

The ECMWF seasonal forecasts (SEAS5) are produced every month with a 51-member ensemble at a ...
Interval/period: N/A
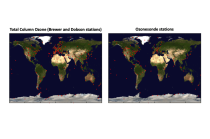
The total ozone estimates are based on solar UV radiation measurements made by ground-based spectrophotometers (Dobson or Brewer type spectrophotometers).
The vertical profiles of ozone concentration are estimated primarily using ozonesonde observations.
Data are available for 159 Dobson stations, 109 Brewer stations and 135 ozonesondes stations.
Interval/period: Tue, 01/01/1924 - Sat, 05/09/2026

Mean wave period is the spectrally averaged period of the waves. Wave periods are shown in seconds using colour shading – click on the middle icon to the bottom right for the scale...
Interval/period: N/A
Interval/period: Thu, 06/01/1995 - Thu, 07/31/2025

This chart shows probability information regarding mean wave period derived from the ECMWF ...
Interval/period: N/A

This chart shows probability information regarding significant wave height derived from the ...
Interval/period: N/A

These charts show the probability of various mean periods of ocean waves 10-15 days ahead. The ...
Interval/period: N/A

The ECMWF seasonal forecasts (SEAS5) are produced every month with a 51-member ensemble at a ...
Interval/period: N/A

The DestinE Digital Twin for Weather-Induced Extremes (Extremes DT) supports responding and adapting to extreme events in a changing world by providing a capability to produce tailored simulations and address what-if scenarios related to extreme events in a past, present and future climate, complementing existing capabilities at national and European level.
Interval/period: N/A

Mean windsea wave direction is the spectrally averaged direction of propagation of the windsea waves (weighted by wave height). Arrow length is proportional to the speed of wave propagation...
Interval/period: N/A

Significant windsea wave height can be shown to correspond to the average wave height of the top one-third highest windsea waves. Wave heights are shown in metres using colour shading...
Interval/period: N/A
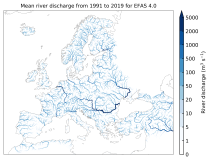
This dataset provides gridded modelled hydrological time series forced with medium-range meteorological forecasts. The data is a consistent representation of the most important hydrological variables across the European Flood Awareness System (EFAS) domain. The temporal resolution is sub-daily high-resolution and ensemble forecasts of:
River discharge
Soil moisture for three soil layers
Snow water equivalent
Interval/period: N/A

These charts show probability of various heights of significant waves 10-15 days ahead. The ...
Interval/period: N/A

Mean total swell wave direction is the spectrally averaged propagation direction of the swell waves (weighted by wave height) of the part of the spectrum that is NOT windsea...
Interval/period: N/A

Wave height is the vertical distance between trough and crest. Wave period is the time between the passage of one wave crest and the next. The arrow direction is the direction the waves are moving towards...
Interval/period: N/A

The ECMWF seasonal forecasts (SEAS5) are produced every month with a 51-member ensemble at a ...
Interval/period: N/A

The ECMWF seasonal forecasts (SEAS5) are produced every month with a 51-member ensemble at a ...
Interval/period: N/A

The charts show mean frequency and accumulated cyclone energy of tropical storm activity. ...
Interval/period: N/A

This chart provides information on the verification of forecasts of the expected number of ...
Interval/period: N/A

The charts show the evolution of existing and potential tropical cyclone activity. ...
Interval/period: N/A
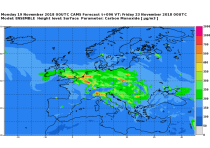
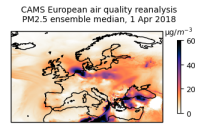
CAMS produces specific daily air quality analyses and forecasts for the European
domain at significantly higher spatial resolution (0.1 degrees, approx. 10km)
than is available from the global analyses and forecasts. The production is
based on an ensemble of eleven air quality forecasting systems across Europe. A
median ensemble is calculated from individual outputs, since ensemble products
Interval/period: Wed, 05/03/2023 - Fri, 05/08/2026

This dataset provides daily air quality analyses and forecasts for Europe.
Interval/period: N/A
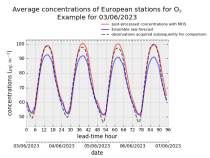
stations after optimisation using a statistical post-processing method called
Model Output Statistics (MOS). The unoptimised "raw" forecasts are also
provided in the same format.
The MOS method uses machine learning with predictive variables including
background air quality observation datasets, ECMWF meteorological forecasts and
the "raw" CAMS European air quality ensemble median forecast. The result is
Interval/period: Wed, 01/17/2024 - Fri, 05/08/2026
Interval/period: Tue, 01/01/2013 - Tue, 12/31/2024