Datasets

This chart provides information on the verification of forecasts of Accumulated Cyclone Energy ...
Interval/period: N/A

The ECMWF seasonal forecasts (SEAS5) are produced every month with a 51-member ensemble at a ...
Interval/period: N/A
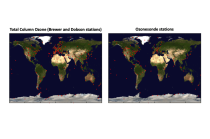
The total ozone estimates are based on solar UV radiation measurements made by ground-based spectrophotometers (Dobson or Brewer type spectrophotometers).
The vertical profiles of ozone concentration are estimated primarily using ozonesonde observations.
Data are available for 159 Dobson stations, 109 Brewer stations and 135 ozonesondes stations.
Interval/period: Tue, 01/01/1924 - Sat, 05/09/2026
Interval/period: Thu, 06/01/1995 - Sat, 05/09/2026
Interval/period: Wed, 01/01/1992 - Sat, 05/09/2026

Mean wave period is the spectrally averaged period of the waves. Wave periods are shown in seconds using colour shading – click on the middle icon to the bottom right for the scale...
Interval/period: N/A
Interval/period: Mon, 01/01/1979 - Wed, 04/01/2026
Interval/period: Sun, 01/01/1950 - Tue, 12/31/2019
Interval/period: Thu, 06/01/1995 - Thu, 07/31/2025
Interval/period: Wed, 01/01/1986 - Sun, 12/31/2023
Interval/period: Wed, 01/01/1986 - Sun, 12/31/2023
Interval/period: Mon, 01/01/1979 - Mon, 09/30/2024
Interval/period: Sat, 01/01/2000 - Sun, 12/31/2017

This chart shows probability information regarding mean wave period derived from the ECMWF ...
Interval/period: N/A

This chart shows probability information regarding significant wave height derived from the ...
Interval/period: N/A

These charts show the probability of various mean periods of ocean waves 10-15 days ahead. The ...
Interval/period: N/A

The ECMWF seasonal forecasts (SEAS5) are produced every month with a 51-member ensemble at a ...
Interval/period: N/A
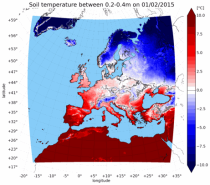
combined with observations using the UERRA-HARMONIE system and MESCAN-SURFEX system.
UERRA-HARMONIE is a 3-dimensional data assimilation system, whereas
MESCAN-SURFEX is a complementary surface analysis system. In general, the
assimilation systems are able to estimate biases between observations and to
sift good-quality data from poor data. The laws of physics allow for estimates
Interval/period: Thu, 10/18/2018 - Wed, 07/31/2019

Mean windsea wave direction is the spectrally averaged direction of propagation of the windsea waves (weighted by wave height). Arrow length is proportional to the speed of wave propagation...
Interval/period: N/A

Significant windsea wave height can be shown to correspond to the average wave height of the top one-third highest windsea waves. Wave heights are shown in metres using colour shading...
Interval/period: N/A
River discharge
Volumetric soil moisture
Snow water equivalent
Soil wetness index (root zone)
Runoff water equivalent (surface plus subsurface)
Interval/period: Thu, 10/11/2018 - Mon, 04/06/2026

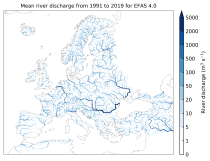
This dataset provides gridded modelled hydrological time series forced with medium-range meteorological forecasts. The data is a consistent representation of the most important hydrological variables across the European Flood Awareness System (EFAS) domain. The temporal resolution is sub-daily high-resolution and ensemble forecasts of:
River discharge
Soil moisture for three soil layers
Snow water equivalent
Interval/period: N/A
River discharge
Soil wetness index (root zone)
Snow water equivalent
Runoff water equivalent (surface plus subsurface)
Interval/period: Tue, 11/05/2019 - Thu, 05/07/2026

River discharge
Volumetric soil moisture
Snow water equivalent
Soil wetness index (root zone)
Runoff water equivalent (surface plus subsurface)
Interval/period: Tue, 01/01/1991 - Tue, 05/05/2026
River discharge
Soil wetness index (root zone)
Snow water equivalent
Runoff water equivalent (surface plus subsurface)
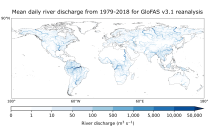
Interval/period: Mon, 01/01/1979 - Tue, 05/05/2026