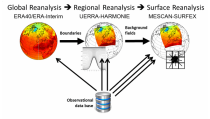
Datasets
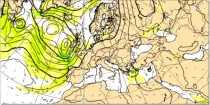
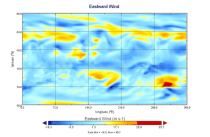
The air flow is not the same at all levels and can be very different in strength and direction when associated with vigorous weather systems...
Interval/period: N/A
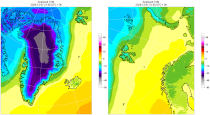
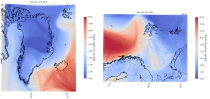
These charts show the difference between the latest HRES Long Window Data Analysis (LWDA) for the main synoptic hours of 00, 06, 12 and 18UTC, and its corresponding background field taken from the previous HRES LWDA run with the same validity time...
Interval/period: N/A
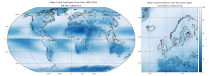
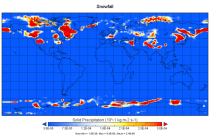
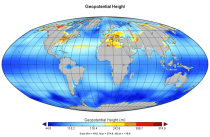
These daily and monthly data are pre-calculated and have the following types depending on the variables: daily and monthly averages, extremes and totals.
Interval/period: Sat, 09/01/1990 - Sat, 02/28/2026
Interval/period: Sat, 09/01/1990 - Sat, 02/28/2026
Interval/period: Sat, 09/01/1990 - Sat, 02/28/2026
Interval/period: Sat, 09/01/1990 - Sat, 02/28/2026
Interval/period: Sat, 09/01/1990 - Sat, 02/28/2026
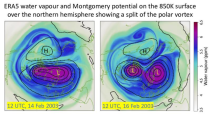
Interval/period: Mon, 01/01/1979 - Mon, 06/30/2025
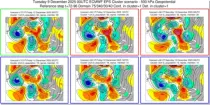
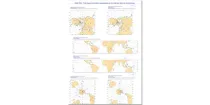
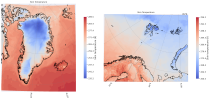
These charts show clustering of ENS members based on the 500 hPa height forecasts. ...
Interval/period: N/A
Interval/period: Sun, 01/01/1860 - Mon, 12/31/2300
Interval/period: Wed, 01/01/1800 - Fri, 12/31/2100
Interval/period: Sun, 01/01/1860 - Mon, 12/31/2300
Interval/period: Sun, 01/01/1860 - Mon, 12/31/2300
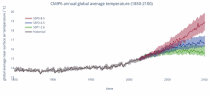
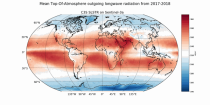
CMIP6 data underpins the Intergovernmental Panel on Climate Change 6th Assessment Report. The use of these data is mostly aimed at:
addressing outstanding scientific questions that arose as part of the IPCC reporting process;
improving the understanding of the climate system;
Interval/period: Sun, 01/01/1860 - Mon, 12/31/2300
Interval/period: Sun, 01/01/1860 - Mon, 12/31/2300
Interval/period: Sat, 01/01/1949 - Mon, 05/11/2026
Interval/period: Thu, 10/18/2018 - Wed, 07/31/2019
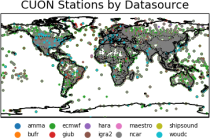
to contain all available observations from balloons ascents through the atmosphere.
The main geophysical variables are temperature, humidity, and wind speed and wind direction,
as functions of atmospheric pressure levels. The observation platforms include pilot balloons, radiosondes, and ozonesondes.
The main observation data sources are:
- the NOAA Integrated Global Radiosonde Archive (IGRA version 2),
- the NCAR Upper-Air Database (UADB), and
Interval/period: Tue, 01/01/1901 - Tue, 12/31/2024
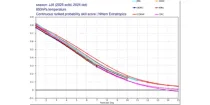
These diagrams compare Continuous Ranked Probability Skill Scores (CRPSS) of ECMWF with ...
Interval/period: N/A
Interval/period: Sun, 01/01/1950 - Fri, 12/31/2100
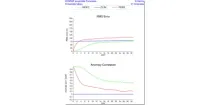
**Note:** In **June 2023** ECMWF implemented a **major upgrade ...**
Interval/period: N/A
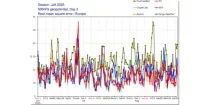
These plots compare recent IFS and experimental AIFS daily verification scores for 500 hPa ...
Interval/period: N/A
Interval/period: Mon, 01/01/1979 - Sun, 02/01/2026
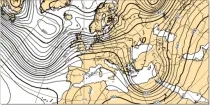
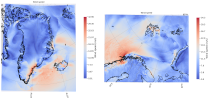
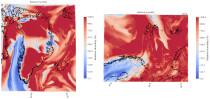
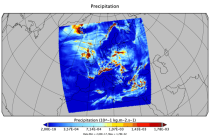
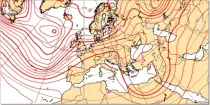
These charts show the mean and variation in the latest ECMWF ensemble forecast (ENS). ...
Interval/period: N/A
These charts show the mean and variation in the latest ECMWF ensemble forecast (ENS). ...
Interval/period: N/A