Datasets
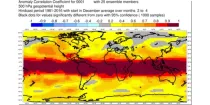
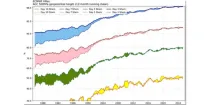
This chart shows the spatial variation in the Anomaly Correlation Coefficient (ACC) for the ...
Interval/period: N/A
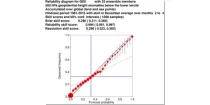
The reliability diagram shows the reliability of the ECMWF seasonal forecast system (SEAS5) with ...
Interval/period: N/A
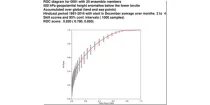
This chart shows the Relative Operating Characteristics (ROC) diagram for the three-month ...
Interval/period: N/A
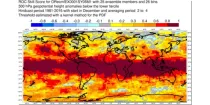
This chart shows the spatial variation in the Relative Operating Characteristics (ROC) skill ...
Interval/period: N/A

The ECMWF seasonal forecasts (SEAS5) are produced every month with a 51-member ensemble at a ...
Interval/period: N/A

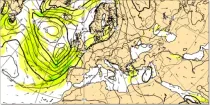
The 850 hPa level is usually just above the boundary layer and at this level the day-night variation in temperature is generally negligible...
Interval/period: N/A

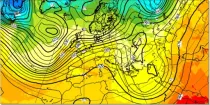
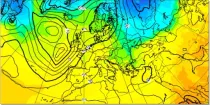
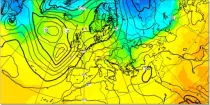
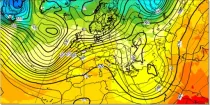
This chart shows 7-day mean anomalies of 500hPa geopotential height from the ECMWF Sub-seasonal ...
Interval/period: N/A

500-1000 hPa thickness is a measure of the mean temperature of a column of the atmosphere between these pressure levels and can be used to distinguish between warm and cold air masses and...
Interval/period: N/A

This chart provides information on the verification of forecasts of Accumulated Cyclone Energy ...
Interval/period: N/A

The ECMWF seasonal forecasts (SEAS5) are produced every month with a 51-member ensemble at a ...
Interval/period: N/A

These charts show indices which indicate the susceptibility of the troposphere to support free convection. Typical values of the different indices depend on location and...
Interval/period: N/A
This diagram gives a measure of the effectiveness of the model in forecasting 500 hPa heights at ...
Interval/period: N/A

This diagram shows time evolution of a Madden-Julian Oscillation (MJO) index. ...
Interval/period: N/A

Mean wave period is the spectrally averaged period of the waves. Wave periods are shown in seconds using colour shading – click on the middle icon to the bottom right for the scale...
Interval/period: N/A
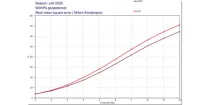
These plots compare recent IFS and experimental AIFS verification scores for 500 hPa ...
Interval/period: N/A
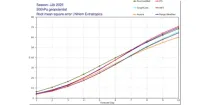
These plots compare recent IFS and experimental AIFS verification scores for 500 hPa ...
Interval/period: N/A
Aurora: a deep learning-based system developed by Microsoft. It is initialised with ECMWF analysis. Aurora operates at 0.1° resolution.
Interval/period: N/A
Aurora: a deep learning-based system developed by Microsoft. It is initialised with ECMWF analysis. Aurora operates at 0.1° resolution.
Interval/period: N/A

Aurora: a deep learning-based system developed by Microsoft. It is initialised with ECMWF analysis. Aurora operates at 0.1° resolution.
Interval/period: N/A

FourCastNet v2-small:a deep learning-based system developed by NVIDIA in collaboration with researchers at several US universities.It is initialised with ECMWF analysis. FourCastNet operates at 0.25° resolution.
Interval/period: N/A
FourCastNet v2-small:a deep learning-based system developed by NVIDIA in collaboration with researchers at several US universities.It is initialised with ECMWF analysis. FourCastNet operates at 0.25° resolution.
Interval/period: N/A

FourCastNet v2-small:a deep learning-based system developed by NVIDIA in collaboration with researchers at several US universities.It is initialised with ECMWF analysis. FourCastNet operates at 0.25° resolution.
Interval/period: N/A
GraphCast (Google DeepMind): a deep learning-based system developed by Google DeepMind.It is initialised with ECMWF analysis. GraphCast operates at 0.25° resolution.
Interval/period: N/A

GraphCast (Google DeepMind): a deep learning-based system developed by Google DeepMind.It is initialised with ECMWF analysis. GraphCast operates at 0.25° resolution.
Interval/period: N/A
GraphCast (Google DeepMind): a deep learning-based system developed by Google DeepMind.It is initialised with ECMWF analysis. GraphCast operates at 0.25° resolution.
Interval/period: N/A