Datasets

Simulated visible images show simulations of the upward flux of radiation (as would be detected by a weather satellite) derived from information using the model representation of temperatures and cloud layers.
Interval/period: N/A
Interval/period: Sun, 10/01/1978 - Mon, 09/29/2025
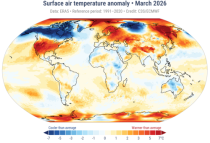
Interval/period: Tue, 01/01/1991 - Thu, 12/31/2020
Interval/period: Wed, 10/25/1978 - Wed, 09/24/2025
Interval/period: Mon, 01/01/1979 - Tue, 09/30/2025
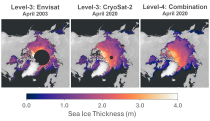
Interval/period: Tue, 10/01/2002 - Sat, 04/12/2025
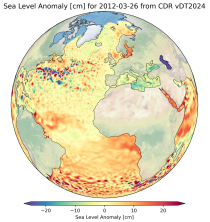
Interval/period: Fri, 01/01/1993 - Sun, 12/31/2023
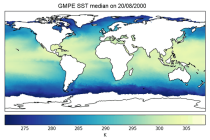
Interval/period: Tue, 09/01/1981 - Sat, 12/31/2016
Interval/period: Mon, 01/01/1979 - Wed, 04/01/2026

This display helps with the recognition of clouds of different layers, even when they overlap. Brighter colouring represents greater cloud cover. Cloud-free areas appear white while areas of full cloud cover at all levels appear dark grey (e.g. active fronts)...
Interval/period: N/A

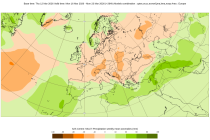
This chart shows probability information regarding visibility near the surface derived from the ...
Interval/period: N/A
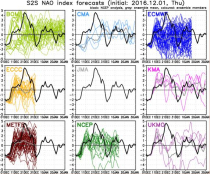
S2S project behind the dataset started in 2013 as a joint initiative of the World Weather Research Programme (WWRP) and the World Climate Research Programme (WCRP).
The goal of S2S project was to improve sub-seasonal forecast skill through combining multiple forecasting systems, enable multi-model evaluations and enhance knowledge sharing between operational centres.
Interval/period: Thu, 01/01/2015 - Wed, 05/06/2026
S2S project behind the dataset started in 2013 as a joint initiative of the World Weather Research Programme (WWRP) and the World Climate Research Programme (WCRP).
The goal of S2S project was to improve sub-seasonal forecast skill through combining multiple forecasting systems, enable multi-model evaluations and enhance knowledge sharing between operational centres.
Interval/period: Tue, 03/01/2011 - Tue, 06/09/2026

This display helps with the recognition of clouds of different layers, even when they overlap. Brighter colouring represents greater cloud cover. Cloud-free areas appear white while areas of full cloud cover at all levels appear dark grey (e.g. active fronts)...
Interval/period: N/A

The DestinE Digital Twin for Climate Change Adaptation (Climate DT) supports adaptation activities by providing innovative climate information on multi-decadal timescales, globally, at scales at which many impacts of climate change are observed. It combines cutting-edge global Earth-system models, impact-sector applications and observations into a unified framework to provide global climate projections and impact-sector information on multi-decadal timescales (1990 to ~2050), at very high spatial resolutions (5 to 10 km).
Interval/period: N/A

Cloud base height is derived by upwardly searching the structure of the model atmosphere to find the altitude where the cloud fraction becomes >1% and...
Interval/period: N/A
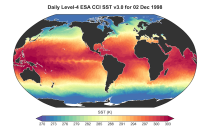
Interval/period: Fri, 01/01/1982 - Tue, 12/31/2024
Interval/period: Mon, 01/01/1951 - Sat, 12/31/2050
Interval/period: Sun, 01/01/1950 - Sat, 12/31/2050
Interval/period: Fri, 07/13/1979 - Tue, 04/21/2026
The nextGEMS data is aligned with the Climate Change Adaptation Digital Twin. The DestinE Digital Twin for Climate Change Adaptation (Climate DT) supports adaptation activities by providing innovative climate information on multi-decadal timescales, globally, at scales at which many impacts of climate change are observed.
Interval/period: N/A