Datasets

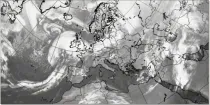
Simulated visible images show simulations of the upward flux of radiation (as would be detected by a weather satellite) derived from information using the model representation of temperatures and cloud layers.
Interval/period: N/A

This display helps with the recognition of clouds of different layers, even when they overlap. Brighter colouring represents greater cloud cover. Cloud-free areas appear white while areas of full cloud cover at all levels appear dark grey (e.g. active fronts)...
Interval/period: N/A

This chart shows probability information regarding visibility near the surface derived from the ...
Interval/period: N/A

This display helps with the recognition of clouds of different layers, even when they overlap. Brighter colouring represents greater cloud cover. Cloud-free areas appear white while areas of full cloud cover at all levels appear dark grey (e.g. active fronts)...
Interval/period: N/A

Interval/period: Wed, 01/01/2003 - Sun, 12/31/2017
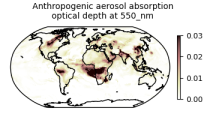
This dataset provides aerosol optical depths and aerosol-radiation radiative effects for four different aerosol origins: anthropogenic, mineral dust, marine, and land-based fine-mode natural aerosol. The latter mostly consists of biogenic aerosols.
Interval/period: N/A

carbon dioxide
methane
tropospheric ozone
stratospheric ozone
interactions between anthropogenic aerosols and radiation
interactions between anthropogenic aerosols and clouds
Interval/period: Wed, 01/01/2003 - Sun, 12/31/2017
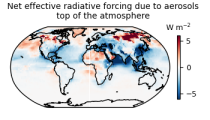
This dataset provides geographical distributions of the radiative forcing (RF) by key atmospheric constituents. The radiative forcing estimates are based on the CAMS reanalysis and additional model simulations and are provided separately for...
- carbon dioxide
- methane
- tropospheric ozone
- stratospheric ozone
- interactions between anthropogenic aerosols and radiation
Interval/period: N/A
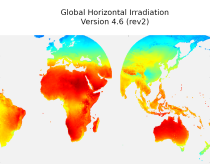
irradiation, as well as direct normal irradiation, on a latitude/longitude grid
covering land surfaces and coastal areas of Europe, Africa, Oceania, Eastern
South America, the Middle East and South-East Asia. It is created from 15 minute
resolved timeseries at each grid point. These timeseries were calculated by the
CAMS Solar Radiation Time Series Service and use information on aerosol, ozone
Interval/period: Sat, 01/01/2005 - Sun, 12/31/2023

Interval/period: Thu, 01/01/2004 - Thu, 05/07/2026
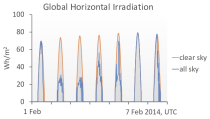
The CAMS solar radiation services provide historical values (2004 to present) of global (GHI), direct (BHI) and diffuse (DHI) solar irradiation, as well as direct normal irradiation (BNI). The aim is to fulfil the needs of European and national policy development and the requirements of both commercial and public downstream services, e.g. for planning, monitoring, efficiency improvements and the integration of solar energy systems into energy supply grids.
Interval/period: N/A

Cloud base height is derived by upwardly searching the structure of the model atmosphere to find the altitude where the cloud fraction becomes >1% and...
Interval/period: N/A
850 hPa wet-bulb potential temperature is commonly used to identify air masses and a strong gradient of wet bulb potential temperature is indicative of fronts between two different air masses...
Interval/period: N/A

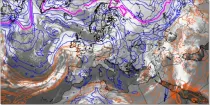
The simulated water vapour images generally focus on the upper troposphere. These charts can often indicate dynamical forcing mechanisms (responsible for cyclogenesis) or convective development (related to potential instability)...
Interval/period: N/A
These products display cloud-related fields from the model in a format that is very familiar to forecasters and that they are used to interpreting. They can easily be compared to actual satellite imagery...
Interval/period: N/A

The simulated water vapour images generally focus on the upper troposphere. These charts can often indicate dynamical forcing mechanisms (responsible for cyclogenesis) or convective development (related to potential instability)...
Interval/period: N/A

This display helps with the recognition of clouds of different layers, even when they overlap. Brighter colouring represents greater cloud cover. Cloud-free areas appear white while areas of full cloud cover at all levels appear dark grey (e.g. active fronts)...
Interval/period: N/A