Datasets
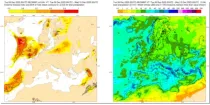
These charts aim to provide pointers to areas where anomalous precipitation amounts are likely to occur during the 24 hour, 2 day, 5 day or 10 day period previous to the selected validity time...
Interval/period: N/A
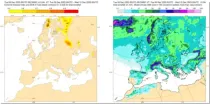
These charts show areas where anomalous snow fall is likely to occur. These charts are based on the ECMWF ensemble for ...
Interval/period: N/A
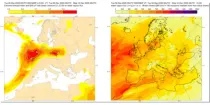
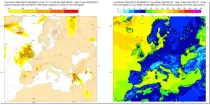
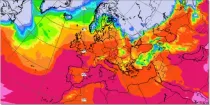
These charts aim to provide pointers to areas where anomalous values of water vapour flux are likely to occur based on the ECMWF en ...
Interval/period: N/A
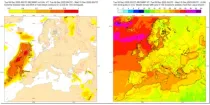
These charts show areas where anomalous 10 m wind gusts are likely to occur. These charts are based on the ECMWF ensemble fore ...
Interval/period: N/A
These charts show areas where anomalous 10 m wind speeds are likely to occur. These charts are based on the ECMWF ensemble for ...
Interval/period: N/A
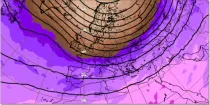
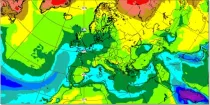
These charts show the mean and variation in the latest ECMWF ensemble forecast (ENS). ...
Interval/period: N/A
These charts show the mean and variation in the latest ECMWF ensemble forecast (ENS). ...
Interval/period: N/A

These charts show the mean and variation in the latest ECMWF ensemble forecast (ENS). ...
Interval/period: N/A
These charts show the mean and variation in the latest ECMWF ensemble forecast (ENS). ...
Interval/period: N/A
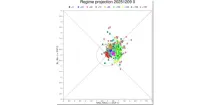
These diagrams aim to show the time evolution of regimes which are indicative of the likely weather in and around Europe.The winds across the Atlantic can usefully be classified into four regimes ...
Interval/period: N/A
These charts represent the height of the air temperature 0°C isotherm or the Wet bulb temperature 0°C isotherm...
Interval/period: N/A

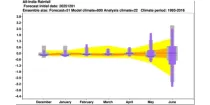
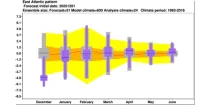
The ECMWF seasonal forecasts (SEAS5) are produced every month with a 51-member ensemble at a ...
Interval/period: N/A

This chart provides information on the verification of forecasts of the number of tropical ...
Interval/period: N/A
The ECMWF seasonal forecasts (SEAS5) are produced every month with a 51-member ensemble at ...
Interval/period: N/A

The nextGEMS data is aligned with the Climate Change Adaptation Digital Twin. The DestinE Digital Twin for Climate Change Adaptation (Climate DT) supports adaptation activities by providing innovative climate information on multi-decadal timescales, globally, at scales at which many impacts of climate change are observed.
Interval/period: N/A
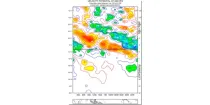
Specific humidity gives an indication of the amount of moisture within a sample of air (in g of water vapour within a kg of air, g kg⁻¹). The chart shows the specific humidity at 1000 hPa and 925 hPa levels and...
Interval/period: N/A
The ECMWF seasonal forecasts (SEAS5) are produced every month with a 51-member ensemble at a ...
Interval/period: N/A
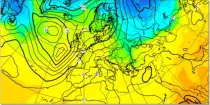
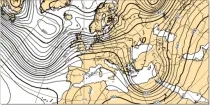
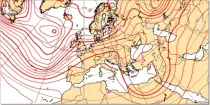
In the northern hemisphere the air rotates anti-clockwise around low contour centres and clockwise around the high contour centres. In the southern hemisphere the air rotates clockwise around low contour centres and ...
Interval/period: N/A
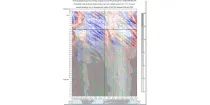
This is a time/longitude diagram (Hovmoller diagram) of 500 hPa or 1000 hPa mean height anomaly ...
Interval/period: N/A
The time-longitude diagram (Hovmoller diagram) shows a section of ensemble mean anomalies or ...
Interval/period: N/A