Datasets
This chart shows 7-day mean anomalies of temperature at 10hPa from the ECMWF Sub-seasonal range ...
Interval/period: N/A
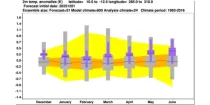
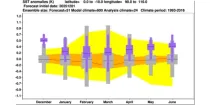
The ECMWF seasonal forecasts (SEAS5) are produced every month with a 51-member ensemble at ...
Interval/period: N/A

The 850 hPa level is usually just above the boundary layer and at this level the day-night variation in temperature is generally negligible...
Interval/period: N/A

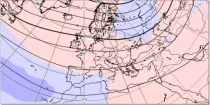
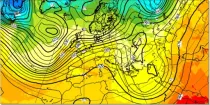
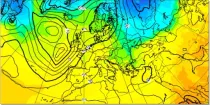
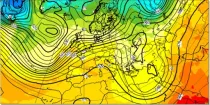
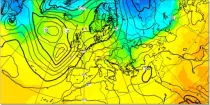
This chart shows 7-day mean anomalies of 500hPa geopotential height from the ECMWF Sub-seasonal ...
Interval/period: N/A

This chart provides information on the verification of forecasts of Accumulated Cyclone Energy ...
Interval/period: N/A

The ECMWF seasonal forecasts (SEAS5) are produced every month with a 51-member ensemble at a ...
Interval/period: N/A

Various thermall comfort parameters showing thermal comfort
Interval/period: N/A

This diagram shows time evolution of a Madden-Julian Oscillation (MJO) index. ...
Interval/period: N/A
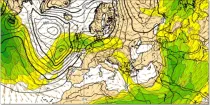
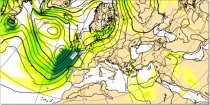
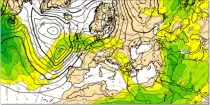
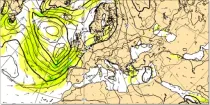
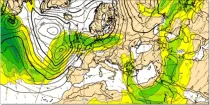
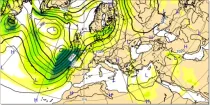
Wind speed at 200 hPa highlights the jet stream (areas of strong winds in the upper troposphere) which can help identify movement and development of depressions...
Interval/period: N/A
Wind speeds near the surface are roughly proportional to the distance between isobars so closely packed isobars mean strong surface winds...
Interval/period: N/A
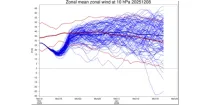
This shows the daily distribution and evolution of mean zonal wind at 10hPa at 60N or 60S. ...
Interval/period: N/A
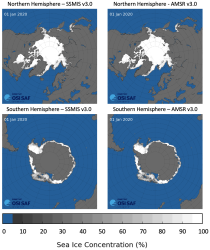
This dataset provides daily gridded data of sea ice concentration for both hemispheres derived from satellite passive microwave brightness temperatures. Sea ice is an important component of our climate system and a sensitive indicator of climate change. Its presence or its retreat has a strong impact on air-sea interactions, the Earth’s energy budget as well as marine ecosystems. It is listed as an Essential Climate Variable by the Global Climate Observing System.
Interval/period: N/A
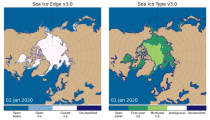
This dataset provides daily gridded data of sea ice edge and sea ice type derived from brightness temperatures measured by satellite passive microwave radiometers. Sea ice is an important component of our climate system and a sensitive indicator of climate change. Its presence or its retreat has a strong impact on air-sea interactions, the Earth’s energy budget as well as marine ecosystems. It is recognized by the Global Climate Observing System as an Essential Climate Variable. Sea ice edge and type are some of the parameters used to characterise sea ice.
Interval/period: N/A
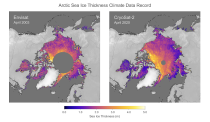
This dataset provides monthly gridded data of sea ice thickness for the Arctic region based on satellite radar altimetry observations. Sea ice is an important component of our climate system and a sensitive indicator of climate change. Its presence or its retreat has a strong impact on air-sea interactions, the Earth’s energy budget as well as marine ecosystems. It is recognized by the Global Climate Observing System as an Essential Climate Variable.
Interval/period: N/A
The ECMWF seasonal forecasts (SEAS5) are produced every month with a 51-member ensemble at ...
Interval/period: N/A
Aurora: a deep learning-based system developed by Microsoft. It is initialised with ECMWF analysis. Aurora operates at 0.1° resolution.
Interval/period: N/A
Aurora: a deep learning-based system developed by Microsoft. It is initialised with ECMWF analysis. Aurora operates at 0.1° resolution.
Interval/period: N/A

Aurora: a deep learning-based system developed by Microsoft. It is initialised with ECMWF analysis. Aurora operates at 0.1° resolution.
Interval/period: N/A
Aurora: a deep learning-based system developed by Microsoft. It is initialised with ECMWF analysis. Aurora operates at 0.1° resolution.
Interval/period: N/A
Aurora: a deep learning-based system developed by Microsoft. It is initialised with ECMWF analysis. Aurora operates at 0.1° resolution.
Interval/period: N/A
FourCastNet v2-small:a deep learning-based system developed by NVIDIA in collaboration with researchers at several US universities.It is initialised with ECMWF analysis. FourCastNet operates at 0.25° resolution.
Interval/period: N/A
FourCastNet v2-small:a deep learning-based system developed by NVIDIA in collaboration with researchers at several US universities.It is initialised with ECMWF analysis. FourCastNet operates at 0.25° resolution.
Interval/period: N/A
FourCastNet v2-small:a deep learning-based system developed by NVIDIA in collaboration with researchers at several US universities.It is initialised with ECMWF analysis. FourCastNet operates at 0.25° resolution.
Interval/period: N/A
FourCastNet v2-small:a deep learning-based system developed by NVIDIA in collaboration with researchers at several US universities.It is initialised with ECMWF analysis. FourCastNet operates at 0.25° resolution.
Interval/period: N/A

FourCastNet v2-small:a deep learning-based system developed by NVIDIA in collaboration with researchers at several US universities.It is initialised with ECMWF analysis. FourCastNet operates at 0.25° resolution.
Interval/period: N/A