Datasets
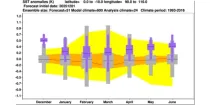
This chart shows 7-day mean anomalies of temperature at 10hPa from the ECMWF Sub-seasonal range ...
Interval/period: N/A
The ECMWF seasonal forecasts (SEAS5) are produced every month with a 51-member ensemble at ...
Interval/period: N/A

The 850 hPa level is usually just above the boundary layer and at this level the day-night variation in temperature is generally negligible...
Interval/period: N/A

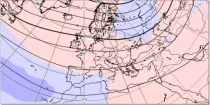
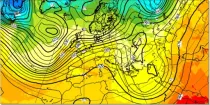
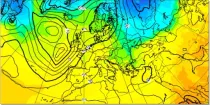
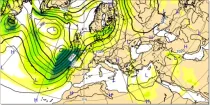
This chart shows 7-day mean anomalies of 500hPa geopotential height from the ECMWF Sub-seasonal ...
Interval/period: N/A

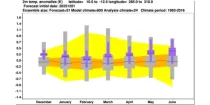
This chart provides information on the verification of forecasts of Accumulated Cyclone Energy ...
Interval/period: N/A

The ECMWF seasonal forecasts (SEAS5) are produced every month with a 51-member ensemble at a ...
Interval/period: N/A
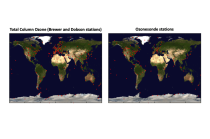
The total ozone estimates are based on solar UV radiation measurements made by ground-based spectrophotometers (Dobson or Brewer type spectrophotometers).
The vertical profiles of ozone concentration are estimated primarily using ozonesonde observations.
Data are available for 159 Dobson stations, 109 Brewer stations and 135 ozonesondes stations.
Interval/period: Tue, 01/01/1924 - Sat, 05/09/2026
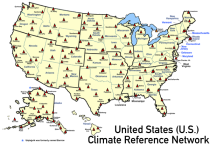
United States Climate Reference Network (USCRN) stations.
There are over 130 USCRN stations over the conterminous United States (U.S.), Alaska, and Hawaii.
The USCRN stations are managed and maintained by the U.S. National Oceanic and Atmospheric Administration (NOAA).
The USCRN observations include air temperature, humidity, wind speed, precipitation, solar radiation,
Interval/period: Sun, 01/01/2006 - Sat, 05/09/2026

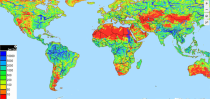
Various thermall comfort parameters showing thermal comfort
Interval/period: N/A

This diagram shows time evolution of a Madden-Julian Oscillation (MJO) index. ...
Interval/period: N/A
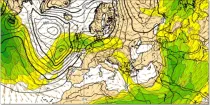
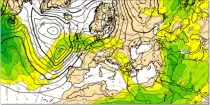
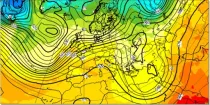
Wind speed at 200 hPa highlights the jet stream (areas of strong winds in the upper troposphere) which can help identify movement and development of depressions...
Interval/period: N/A
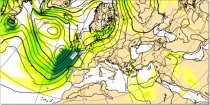
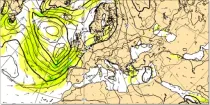
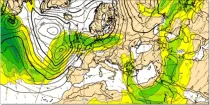
Wind speeds near the surface are roughly proportional to the distance between isobars so closely packed isobars mean strong surface winds...
Interval/period: N/A

Mean wave period is the spectrally averaged period of the waves. Wave periods are shown in seconds using colour shading – click on the middle icon to the bottom right for the scale...
Interval/period: N/A
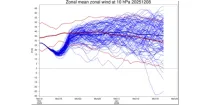
This shows the daily distribution and evolution of mean zonal wind at 10hPa at 60N or 60S. ...
Interval/period: N/A
The ECMWF seasonal forecasts (SEAS5) are produced every month with a 51-member ensemble at ...
Interval/period: N/A
Interval/period: Mon, 01/01/1979 - Wed, 04/01/2026
The data are bias adjusted using the Distribution Based Scaling (DBS) method versus the global reference dataset HydroGFD2.0, both bias adjustment method and global reference dataset developed by the Swedish Meteorological and Hydrological Institute (SMHI).
The DBS method is a parametric quantile-mapping variant.
Interval/period: Thu, 10/12/2000 - Thu, 10/18/2018
Aurora: a deep learning-based system developed by Microsoft. It is initialised with ECMWF analysis. Aurora operates at 0.1° resolution.
Interval/period: N/A
Aurora: a deep learning-based system developed by Microsoft. It is initialised with ECMWF analysis. Aurora operates at 0.1° resolution.
Interval/period: N/A

Aurora: a deep learning-based system developed by Microsoft. It is initialised with ECMWF analysis. Aurora operates at 0.1° resolution.
Interval/period: N/A
Aurora: a deep learning-based system developed by Microsoft. It is initialised with ECMWF analysis. Aurora operates at 0.1° resolution.
Interval/period: N/A
Aurora: a deep learning-based system developed by Microsoft. It is initialised with ECMWF analysis. Aurora operates at 0.1° resolution.
Interval/period: N/A
FourCastNet v2-small:a deep learning-based system developed by NVIDIA in collaboration with researchers at several US universities.It is initialised with ECMWF analysis. FourCastNet operates at 0.25° resolution.
Interval/period: N/A
FourCastNet v2-small:a deep learning-based system developed by NVIDIA in collaboration with researchers at several US universities.It is initialised with ECMWF analysis. FourCastNet operates at 0.25° resolution.
Interval/period: N/A
FourCastNet v2-small:a deep learning-based system developed by NVIDIA in collaboration with researchers at several US universities.It is initialised with ECMWF analysis. FourCastNet operates at 0.25° resolution.
Interval/period: N/A