Datasets

The ECMWF seasonal forecasts (SEAS5) are produced every month with a 51-member ensemble at a ...
Interval/period: N/A

The ECMWF seasonal forecasts (SEAS5) are produced every month with a 51-member ensemble at a ...
Interval/period: N/A

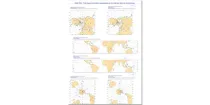
The charts show mean frequency and accumulated cyclone energy of tropical storm activity. ...
Interval/period: N/A

This chart provides information on the verification of forecasts of the expected number of ...
Interval/period: N/A

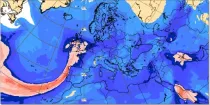
The charts show the evolution of existing and potential tropical cyclone activity. ...
Interval/period: N/A
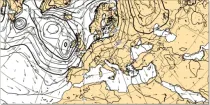
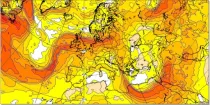
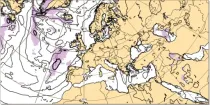
These charts show surface pressure patterns. Areas of high pressure (anticyclones) are usually associated with settled weather...
Interval/period: N/A

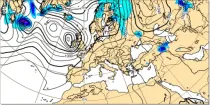
Wind speed at 200 hPa highlights the jet stream (areas of strong winds in the upper troposphere) which can help identify movement and development of depressions...
Interval/period: N/A

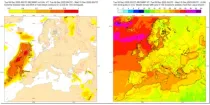
Wind speeds near the surface are roughly proportional to the distance between isobars so closely packed isobars mean strong surface winds...
Interval/period: N/A
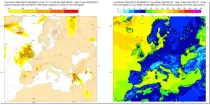
The charts show the forecast value of the vertically integrated total column water (vapour + cloud water + cloud ice but with no precipitation included) in units of kg m⁻²...
Interval/period: N/A
Forecast precipitation is considered to be snow if the model atmosphere above and at the ground surface is forecast to be below 0°C. Where the ground surface lies near the 0°C level...
Interval/period: N/A
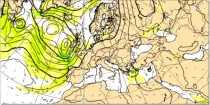
The air flow is not the same at all levels and can be very different in strength and direction when associated with vigorous weather systems...
Interval/period: N/A
These charts show the difference between the latest HRES Long Window Data Analysis (LWDA) for the main synoptic hours of 00, 06, 12 and 18UTC, and its corresponding background field taken from the previous HRES LWDA run with the same validity time...
Interval/period: N/A
Bulk Wind Shear charts show the scalar value of the shear between the winds at the two pressure levels selected. Shear can be useful in assessing the strength of a front or...
Interval/period: N/A
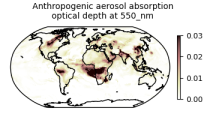
This dataset provides aerosol optical depths and aerosol-radiation radiative effects for four different aerosol origins: anthropogenic, mineral dust, marine, and land-based fine-mode natural aerosol. The latter mostly consists of biogenic aerosols.
Interval/period: N/A
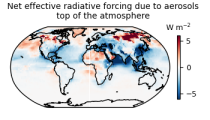
This dataset provides geographical distributions of the radiative forcing (RF) by key atmospheric constituents. The radiative forcing estimates are based on the CAMS reanalysis and additional model simulations and are provided separately for...
- carbon dioxide
- methane
- tropospheric ozone
- stratospheric ozone
- interactions between anthropogenic aerosols and radiation
Interval/period: N/A
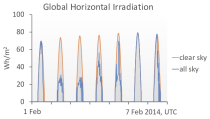
The CAMS solar radiation services provide historical values (2004 to present) of global (GHI), direct (BHI) and diffuse (DHI) solar irradiation, as well as direct normal irradiation (BNI). The aim is to fulfil the needs of European and national policy development and the requirements of both commercial and public downstream services, e.g. for planning, monitoring, efficiency improvements and the integration of solar energy systems into energy supply grids.
Interval/period: N/A
The CAT (Clear Air Turbulence) parameter is given in units of the turbulent Eddy Dissipation Rate (EDR), product shows EDR values on selected flight levels overlayed with wind speeds.
Interval/period: N/A
This chart shows the probability that both the wind at 10 m above the earth's surface is ...
Interval/period: N/A
This chart shows the probability that both the wind at 10 m above the earth's surface is ...
Interval/period: N/A

This chart shows the probability that both the wind at 10 m above the earth's surface is ...
Interval/period: N/A
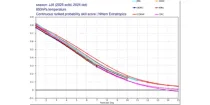
These diagrams compare Continuous Ranked Probability Skill Scores (CRPSS) of ECMWF with ...
Interval/period: N/A
Divergence of horizontal air flow or winds is a measure of the spreading out of air at a particular point. Divergence is +ve where air spreads out; –ve where air converges...
Interval/period: N/A
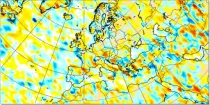
These charts show areas where anomalous 10 m wind gusts are likely to occur. These charts are based on the ECMWF ensemble fore ...
Interval/period: N/A
These charts show areas where anomalous 10 m wind speeds are likely to occur. These charts are based on the ECMWF ensemble for ...
Interval/period: N/A
Spread usually, but not always, increases with forecast range. Spread refers to the uncertainty of the values of a parameter but it does not necessarily refer to the flow patterns...
Interval/period: N/A