Datasets
Interval/period: N/A
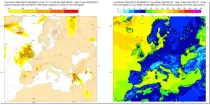
This chart shows the probability that both the wind at 10 m above the earth's surface is ...
Interval/period: N/A
This chart shows the probability that both the wind at 10 m above the earth's surface is ...
Interval/period: N/A

This chart shows the probability that both the wind at 10 m above the earth's surface is ...
Interval/period: N/A
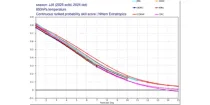
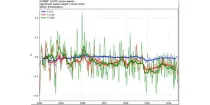
These diagrams compare Continuous Ranked Probability Skill Scores (CRPSS) of ECMWF with ...
Interval/period: N/A
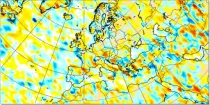
Divergence of horizontal air flow or winds is a measure of the spreading out of air at a particular point. Divergence is +ve where air spreads out; –ve where air converges...
Interval/period: N/A
Interval/period: Sun, 01/01/1950 - Thu, 12/31/2099
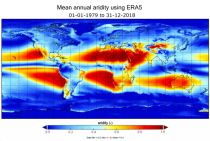
Interval/period: Mon, 01/01/1979 - Mon, 12/31/2018
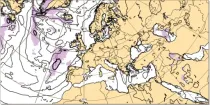
These charts show areas where anomalous 10 m wind gusts are likely to occur. These charts are based on the ECMWF ensemble fore ...
Interval/period: N/A
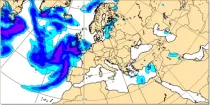
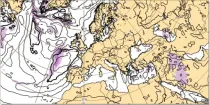
These charts show areas where anomalous 10 m wind speeds are likely to occur. These charts are based on the ECMWF ensemble for ...
Interval/period: N/A
Spread usually, but not always, increases with forecast range. Spread refers to the uncertainty of the values of a parameter but it does not necessarily refer to the flow patterns...
Interval/period: N/A
The ensemble mean is the mean value derived from all the 50 ensemble members plus the control member. This value attempts to capture the general picture while smoothing out spurious detail...
Interval/period: N/A

These charts show the mean and variation in the latest ECMWF ensemble forecast (ENS). ...
Interval/period: N/A
Fifth Generation of the European Centre for Medium-Range Weather Forecasts (ECMWF) Reanalysis (ERA5).
Produced by replaying only the land component of the ECMWF ERA5 climate reanalysis, it benefits from the same physical data-assimilation framework but runs offline at
higher spatial detail (9 km grid) to deliver richer land-surface information.
Interval/period: Sun, 01/01/1950 - Thu, 12/31/2026
Interval/period: Sun, 01/01/1950 - Sat, 05/02/2026
Interval/period: Sun, 01/01/1950 - Wed, 04/01/2026
Interval/period: Sun, 01/01/1950 - Sat, 05/02/2026
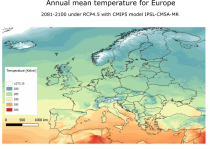
Interval/period: Sun, 01/01/1950 - Thu, 12/31/2099
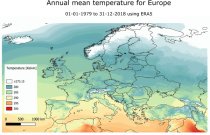
Interval/period: Mon, 01/01/1979 - Mon, 12/31/2018

The ECMWF seasonal forecasts (SEAS5) are produced every month with a 51-member ensemble at a ...
Interval/period: N/A

This chart provides information on the verification of forecasts of the number of tropical ...
Interval/period: N/A
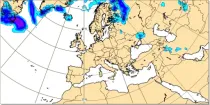
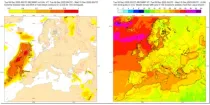
These charts aim to point towards areas where anomalous weather is likely to occur. ...
Interval/period: N/A
This chart shows 7-day mean anomalies for a range of parameters from the ECMWF Sub-seasonal ...
Interval/period: N/A
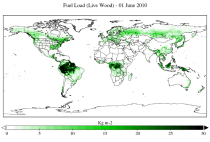
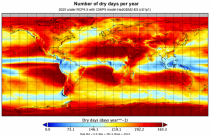
The two main variable groups are fuel load and fuel moisture, both of which are further divided by live/dead and wood/foliage fractions.
The dataset combines state-of-the-art model data (ERA5-Land) with observations from multiple satellites and in-situ variables into a globally complete and consistent dataset.
Interval/period: Wed, 01/01/2003 - Fri, 12/31/2021
These diagrams show verification scores for significant wave height and 10 m wind for three ...
Interval/period: N/A