Datasets
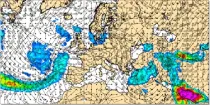
Bulk Wind Shearcharts show the vector value (in wind arrow form) of the shear between the low level, near surface level (10 m) and a mid-tropospheric level (about 6 km)...
Interval/period: N/A
The surface wind is influenced by the roughness of the earth's surface and is likely to be less strong, and a little backed (in the northern hemisphere) or veered (in the southern hemisphere)...
Interval/period: N/A
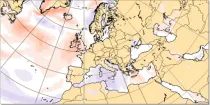
This chart shows the anomaly in the wind speed at 10 m above the earth's surface (in m/s) ...
Interval/period: N/A
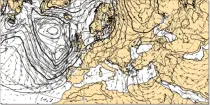
These charts show surface pressure patterns. Areas of high pressure (anticyclones) are usually associated with settled weather...
Interval/period: N/A
Air temperatures at 2 m above the earth's surface approximate most closely to the conditions a person would most likely experience...
Interval/period: N/A
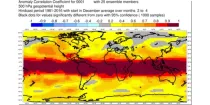
This chart shows the spatial variation in the Anomaly Correlation Coefficient (ACC) for the ...
Interval/period: N/A
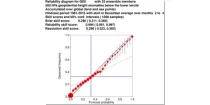
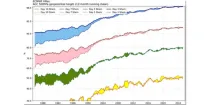
The reliability diagram shows the reliability of the ECMWF seasonal forecast system (SEAS5) with ...
Interval/period: N/A
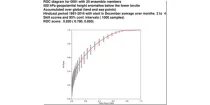
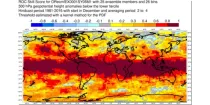
This chart shows the Relative Operating Characteristics (ROC) diagram for the three-month ...
Interval/period: N/A
This chart shows the spatial variation in the Relative Operating Characteristics (ROC) skill ...
Interval/period: N/A

The ECMWF seasonal forecasts (SEAS5) are produced every month with a 51-member ensemble at a ...
Interval/period: N/A

The 850 hPa level is usually just above the boundary layer and at this level the day-night variation in temperature is generally negligible...
Interval/period: N/A

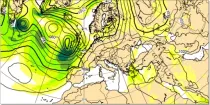
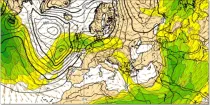
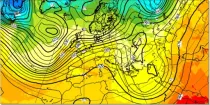
This chart shows 7-day mean anomalies of 500hPa geopotential height from the ECMWF Sub-seasonal ...
Interval/period: N/A

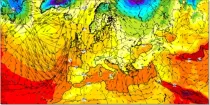
500-1000 hPa thickness is a measure of the mean temperature of a column of the atmosphere between these pressure levels and can be used to distinguish between warm and cold air masses and...
Interval/period: N/A

This chart provides information on the verification of forecasts of Accumulated Cyclone Energy ...
Interval/period: N/A

The ECMWF seasonal forecasts (SEAS5) are produced every month with a 51-member ensemble at a ...
Interval/period: N/A

Various thermall comfort parameters showing thermal comfort
Interval/period: N/A
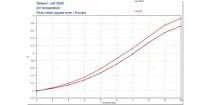
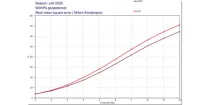
This diagram gives a measure of the effectiveness of the model in forecasting 500 hPa heights at ...
Interval/period: N/A
Maximum Wind gusts at 10 m above the earth's surface during the 6 hour period previous to the selected validity time are shown using colour shading. 10 m wind gusts are a post-processed product...
Interval/period: N/A
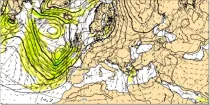
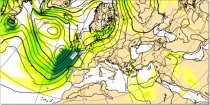
Wind speed at 200 hPa highlights the jet stream (areas of strong winds in the upper troposphere) which can help identify movement and development of depressions...
Interval/period: N/A
Wind speeds near the surface are roughly proportional to the distance between isobars so closely packed isobars mean strong surface winds...
Interval/period: N/A
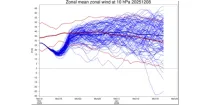
This shows the daily distribution and evolution of mean zonal wind at 10hPa at 60N or 60S. ...
Interval/period: N/A
Scores of forecasts of surface parameters by experimental machine learning models
Interval/period: N/A
These plots compare recent IFS and experimental AIFS verification scores for 500 hPa ...
Interval/period: N/A
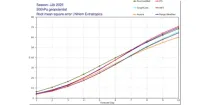
These plots compare recent IFS and experimental AIFS verification scores for 500 hPa ...
Interval/period: N/A
Aurora: a deep learning-based system developed by Microsoft. It is initialised with ECMWF analysis. Aurora operates at 0.1° resolution.
Interval/period: N/A