Datasets
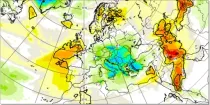
This chart aims to highlight areas where unusually anomalous precipitation is likely to ...
Interval/period: N/A
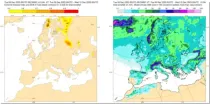
These charts show areas where anomalous snow fall is likely to occur. These charts are based on the ECMWF ensemble for ...
Interval/period: N/A
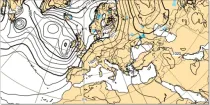
Where precipitation is forecast, a type of precipitation can be assigned according to the temperature structure of the model atmosphere that includes the layers through which the model precipitation falls...
Interval/period: N/A
**Note:** In **June 2023** ECMWF implemented a **major upgrade ...**
Interval/period: N/A
The ECMWF seasonal forecasts (SEAS5) are produced every month with a 51-member ensemble at ...
Interval/period: N/A
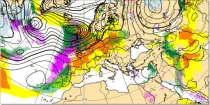
These charts aim to point towards areas where anomalous weather is likely to occur. ...
Interval/period: N/A

The nextGEMS data is aligned with the Climate Change Adaptation Digital Twin. The DestinE Digital Twin for Climate Change Adaptation (Climate DT) supports adaptation activities by providing innovative climate information on multi-decadal timescales, globally, at scales at which many impacts of climate change are observed.
Interval/period: N/A
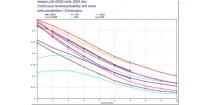
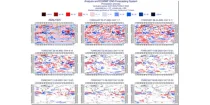
These diagrams compare the Brier Skill Scores (BSS) and the Continuous Ranked Probability ...
Interval/period: N/A
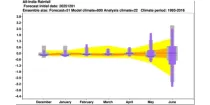
Total accumulated rainfall charts identify areas at greater risk of significant rainfall (or rain equivalent e.g.snowfall) but give no information regarding whether this occurs over a short or prolonged time period...
Interval/period: N/A