Datasets
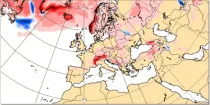
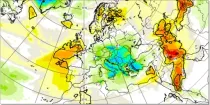
This chart shows the anomaly in precipitation (in mm of rainfall or rainfall equivalent) during a 24 hour period immediately prior to the chosen valid date/time...
Interval/period: N/A
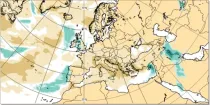
This chart shows the anomaly in snowfall (in mm of rainfall equivalent) during a 24 hour period immediately prior to the chosen valid date/time...
Interval/period: N/A

Mean total swell wave direction is the spectrally averaged propagation direction of the swell waves (weighted by wave height) of the part of the spectrum that is NOT windsea...
Interval/period: N/A

Wave height is the vertical distance between trough and crest. Wave period is the time between the passage of one wave crest and the next. The arrow direction is the direction the waves are moving towards...
Interval/period: N/A

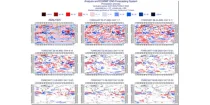
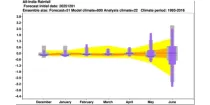
The ECMWF seasonal forecasts (SEAS5) are produced every month with a 51-member ensemble at a ...
Interval/period: N/A

The ECMWF seasonal forecasts (SEAS5) are produced every month with a 51-member ensemble at a ...
Interval/period: N/A

The charts show mean frequency and accumulated cyclone energy of tropical storm activity. ...
Interval/period: N/A

This chart provides information on the verification of forecasts of the expected number of ...
Interval/period: N/A

The charts show the evolution of existing and potential tropical cyclone activity. ...
Interval/period: N/A
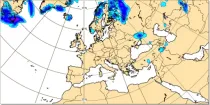
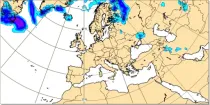
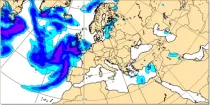
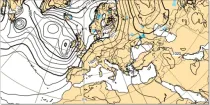
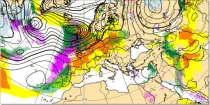
Precipitation totals include all precipitation types (rain, snow etc.) (in mm of rainfall or rainfall equivalent) falling in 6 hour or 12 hour periods using colour shading...
Interval/period: N/A
Total accumulated rainfall charts identify areas at greater risk of significant rainfall (or rain equivalent e.g.snowfall) but give no information regarding whether this occurs over a short or prolonged time period...
Interval/period: N/A
This chart shows the probability that the temperature at 2 m above the earth’s surface is below 0°C and the total of convective and broad scale precipitation ...
Interval/period: N/A
This chart shows the probability that both the wind at 10 m above the earth's surface is ...
Interval/period: N/A
This chart shows the probability that both the wind at 10 m above the earth's surface is ...
Interval/period: N/A

This chart shows the probability that both the wind at 10 m above the earth's surface is ...
Interval/period: N/A
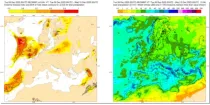
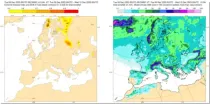
These charts aim to provide pointers to areas where anomalous precipitation amounts are likely to occur during the 24 hour, 2 day, 5 day or 10 day period previous to the selected validity time...
Interval/period: N/A
This chart aims to highlight areas where unusually anomalous precipitation is likely to ...
Interval/period: N/A
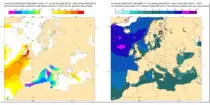
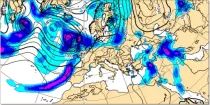
These charts show areas where anomalous significant wave heights are likely to occur. These charts are based on the ECMWF ense ...
Interval/period: N/A
These charts show areas where anomalous snow fall is likely to occur. These charts are based on the ECMWF ensemble for ...
Interval/period: N/A
Where precipitation is forecast, a type of precipitation can be assigned according to the temperature structure of the model atmosphere that includes the layers through which the model precipitation falls...
Interval/period: N/A
**Note:** In **June 2023** ECMWF implemented a **major upgrade ...**
Interval/period: N/A

The ECMWF seasonal forecasts (SEAS5) are produced every month with a 51-member ensemble at a ...
Interval/period: N/A

This chart provides information on the verification of forecasts of the number of tropical ...
Interval/period: N/A
The ECMWF seasonal forecasts (SEAS5) are produced every month with a 51-member ensemble at ...
Interval/period: N/A
These charts aim to point towards areas where anomalous weather is likely to occur. ...
Interval/period: N/A