Datasets

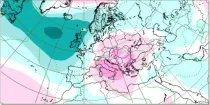
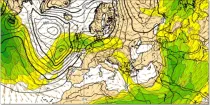
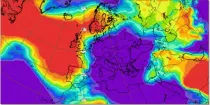
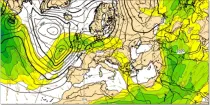
500-1000 hPa thickness is a measure of the mean temperature of a column of the atmosphere between these pressure levels and can be used to distinguish between warm and cold air masses and...
Interval/period: N/A
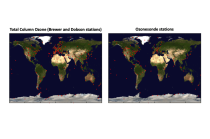
The total ozone estimates are based on solar UV radiation measurements made by ground-based spectrophotometers (Dobson or Brewer type spectrophotometers).
The vertical profiles of ozone concentration are estimated primarily using ozonesonde observations.
Data are available for 159 Dobson stations, 109 Brewer stations and 135 ozonesondes stations.
Interval/period: Tue, 01/01/1924 - Sat, 05/09/2026
Interval/period: Thu, 06/01/1995 - Sat, 05/09/2026
Interval/period: Wed, 01/01/1992 - Sat, 05/09/2026
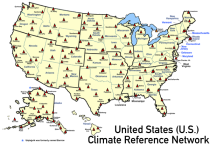
United States Climate Reference Network (USCRN) stations.
There are over 130 USCRN stations over the conterminous United States (U.S.), Alaska, and Hawaii.
The USCRN stations are managed and maintained by the U.S. National Oceanic and Atmospheric Administration (NOAA).
The USCRN observations include air temperature, humidity, wind speed, precipitation, solar radiation,
Interval/period: Sun, 01/01/2006 - Sat, 05/09/2026
Detailed information on these EXPERIMENTAL products can be found
Interval/period: N/A
**Note:** In **June 2023** ECMWF implemented a **major upgrade ...**
Interval/period: N/A
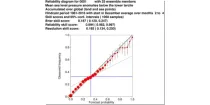
The reliability diagram shows the reliability of the ECMWF seasonal forecast system (SEAS5) with ...
Interval/period: N/A
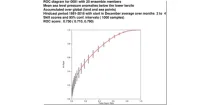
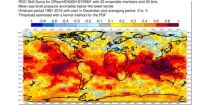
This chart shows the Relative Operating Characteristics (ROC) diagram for the three-month ...
Interval/period: N/A
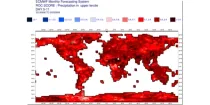
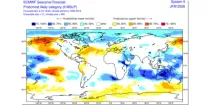
This chart shows the spatial variation in the Relative Operating Characteristics (ROC) skill ...
Interval/period: N/A
The ECMWF seasonal forecasts (SEAS5) are produced every month with a 51-member ensemble at a ...
Interval/period: N/A
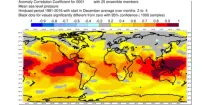
This chart shows the spatial variation in the Anomaly Correlation Coefficient (ACC) for the ...
Interval/period: N/A
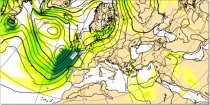
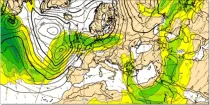
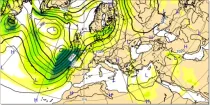
Wind speed at 200 hPa highlights the jet stream (areas of strong winds in the upper troposphere) which can help identify movement and development of depressions...
Interval/period: N/A
Wind speeds near the surface are roughly proportional to the distance between isobars so closely packed isobars mean strong surface winds...
Interval/period: N/A
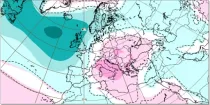
This chart shows probabilities for the 7-day mean anomalies of mean sea level pressure (mslp) to ...
Interval/period: N/A
This chart shows probabilities that the 7-day mean of mean sea level pressure (from the 101 ...
Interval/period: N/A
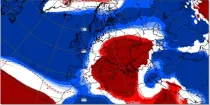
This chart shows 7-day mean anomalies of mean sea level pressure (mslp) from the ECMWF ...
Interval/period: N/A
Interval/period: Mon, 01/01/1979 - Wed, 04/01/2026
The data are bias adjusted using the Distribution Based Scaling (DBS) method versus the global reference dataset HydroGFD2.0, both bias adjustment method and global reference dataset developed by the Swedish Meteorological and Hydrological Institute (SMHI).
The DBS method is a parametric quantile-mapping variant.
Interval/period: Thu, 10/12/2000 - Thu, 10/18/2018

Aurora: a deep learning-based system developed by Microsoft. It is initialised with ECMWF analysis. Aurora operates at 0.1° resolution.
Interval/period: N/A

Aurora: a deep learning-based system developed by Microsoft. It is initialised with ECMWF analysis. Aurora operates at 0.1° resolution.
Interval/period: N/A
FourCastNet v2-small:a deep learning-based system developed by NVIDIA in collaboration with researchers at several US universities.It is initialised with ECMWF analysis. FourCastNet operates at 0.25° resolution.
Interval/period: N/A
FourCastNet v2-small:a deep learning-based system developed by NVIDIA in collaboration with researchers at several US universities.It is initialised with ECMWF analysis. FourCastNet operates at 0.25° resolution.
Interval/period: N/A
GraphCast (Google DeepMind): a deep learning-based system developed by Google DeepMind.It is initialised with ECMWF analysis. GraphCast operates at 0.25° resolution.
Interval/period: N/A

GraphCast (Google DeepMind): a deep learning-based system developed by Google DeepMind.It is initialised with ECMWF analysis. GraphCast operates at 0.25° resolution.
Interval/period: N/A