Datasets
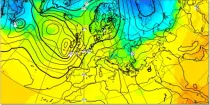
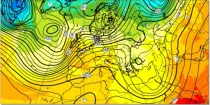
In the northern hemisphere the air rotates anti-clockwise around low contour centres and clockwise around the high contour centres. In the southern hemisphere the air rotates clockwise around low contour centres and ...
Interval/period: N/A
AIFS ENS: a deep learning-based system developed by ECMWF. It is initialised with ECMWF perturbed forecasts and operates at N320 (~0.25Deg) resolution
Interval/period: N/A
AIFS ENS: a deep learning-based system developed by ECMWF. It is initialised with ECMWF perturbed forecasts and operates at N320 (~0.25Deg) resolution
Interval/period: N/A
AIFS ENS: a deep learning-based system developed by ECMWF. It is initialised with ECMWF perturbed forecasts and operates at N320 (~0.25Deg) resolution
Interval/period: N/A

These charts show MSLP and 850hPa forecasts for the Ensemble Control Forecast, and 50 ENS ...
Interval/period: N/A
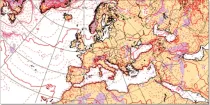
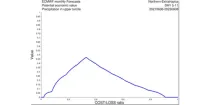
This chart shows probability information regarding dew point temperature 2 m above the ground derived from the ECMWF ensemble (ENS) at the validity time...
Interval/period: N/A
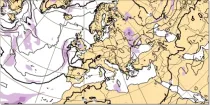
These charts are derived from the ECMWF ensemble forecast (ENS) system and show probability of 2 ...
Interval/period: N/A
These charts are derived from the ECMWF ensemble forecast (ENS) system. They show probability ...
Interval/period: N/A
This chart shows probability information regarding maximum temperature 2 m above the ground derived from the ECMWF ensemble (ENS) during the 6 hour period preceding the validity time...
Interval/period: N/A
This chart shows probability information regarding minimum temperature 2 m above the ground derived from the ECMWF ensemble (ENS) during the 6 hour period preceding the validity time...
Interval/period: N/A
**Note:** In **June 2023** ECMWF implemented a **major upgrade ...**
Interval/period: N/A
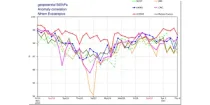
These diagrams compare recent ECMWF verification scores for 500 hPa height with those of other ...
Interval/period: N/A
**Note:** In **June 2023** ECMWF implemented a **major upgrade ...**
Interval/period: N/A
This diagram gives a measure of the effectiveness of the model. The drop-down menu can ...
Interval/period: N/A
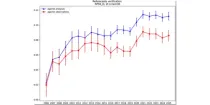
This diagram gives a measure of the effectiveness of the model. ...
Interval/period: N/A
**Note:** In **June 2023** ECMWF implemented a **major upgrade ...**
Interval/period: N/A

This diagram gives a measure of the effectiveness of the model. ...
Interval/period: N/A
**Note:** In **June 2023** ECMWF implemented a **major upgrade ...**
Interval/period: N/A

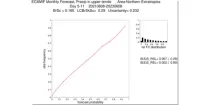
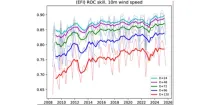
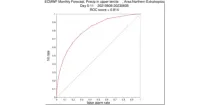
This diagram shows the variation of Relative Operating Characteristics (ROC) scores with various ...
Interval/period: N/A
Dew Point Temperature at 2 m above the earth’s surface gives an indication of conditions which a person will experience or feel. High dewpoint temperatures inhibit heat loss from the body by perspriation and...
Interval/period: N/A
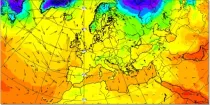
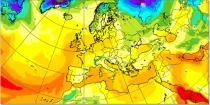
Temperatures at 2 m above the earth’s surface and winds at 10 m above the earth’s surface approximate most closely to the conditions that a person would experience.
Interval/period: N/A
The 850 hPa level is usually just above the boundary layer and at this level the day-night variation in temperature is generally negligible...
Interval/period: N/A

In the northern hemisphere the air rotates anti-clockwise around low contour centres and clockwise around the high contour centres. In the southern hemisphere the air rotates clockwise around low contour centres and ...
Interval/period: N/A

CAMS Global atmospheric composition forecast production system is used to produce the daily forecasts of pollutants, aerosols and greenhouse gases across the globe. Satellite observations of atmospheric composition are merged with a detailed computer simulation of the atmosphere using a method called data assimilation. The resulting analyses, i.e.
Interval/period: N/A
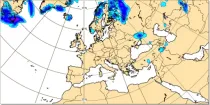
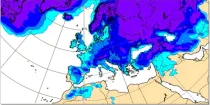
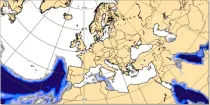
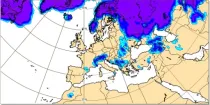
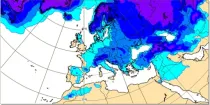
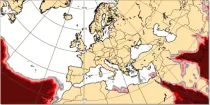
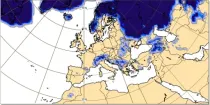
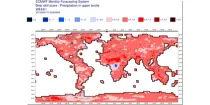
This chart shows the probability that the temperature at 2 m above the earth’s surface is below 0°C and the total of convective and broad scale precipitation ...
Interval/period: N/A