Datasets
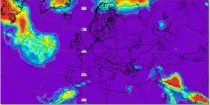
Dew Point Temperature at 2 m above the earth’s surface gives an indication of conditions which a person will experience or feel. High dewpoint temperatures inhibit heat loss from the body by perspriation and...
Interval/period: N/A
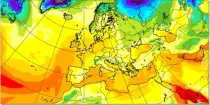
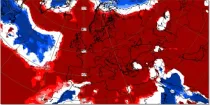
Temperatures at 2 m above the earth’s surface and winds at 10 m above the earth’s surface approximate most closely to the conditions that a person would experience.
Interval/period: N/A
Air temperatures at 2 m above the earth's surface approximate most closely to the conditions a person would most likely experience...
Interval/period: N/A
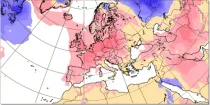
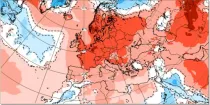
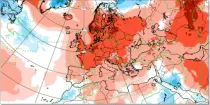
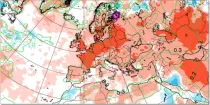
This chart shows the anomaly in the temperature at 2 m above the earth’s surface (in °C) during a 24 hour period immediately preceding the chosen valid date/time...
Interval/period: N/A
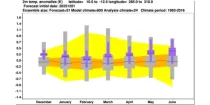
This chart shows probabilities for the 7-day mean anomalies of 2 m air temperature to be in ...
Interval/period: N/A
This chart shows probabilities that 7-day mean 2 m air temperatures (from the 101 forecast ...
Interval/period: N/A
This chart shows 7-day mean anomalies of 2m air temperature from the ECMWF Sub-seasonal range ...
Interval/period: N/A
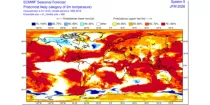
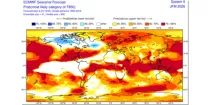
The ECMWF seasonal forecasts (SEAS5) are produced every month with a 51-member ensemble at ...
Interval/period: N/A
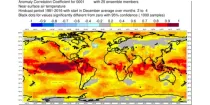
This chart shows the spatial variation in the Anomaly Correlation Coefficient (ACC) for the ...
Interval/period: N/A
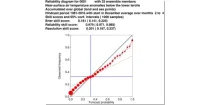
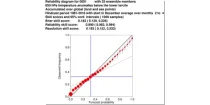
The reliability diagram shows the reliability of the ECMWF seasonal forecast system (SEAS5) with ...
Interval/period: N/A
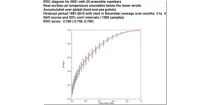
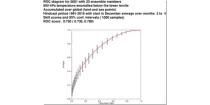
This chart shows the Relative Operating Characteristics (ROC) diagram for the three-month ...
Interval/period: N/A
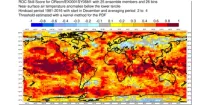
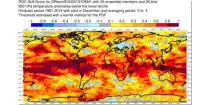
This chart shows the spatial variation in the Relative Operating Characteristics (ROC) skill ...
Interval/period: N/A
The ECMWF seasonal forecasts (SEAS5) are produced every month with a 51-member ensemble at a ...
Interval/period: N/A

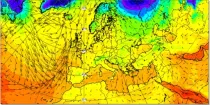
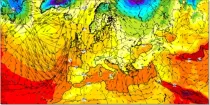
The 850 hPa level is usually just above the boundary layer and at this level the day-night variation in temperature is generally negligible...
Interval/period: N/A
The reliability diagram shows the reliability of the ECMWF seasonal forecast system (SEAS5) with ...
Interval/period: N/A
This chart shows the Relative Operating Characteristics (ROC) diagram for the three-month ...
Interval/period: N/A
This chart shows the spatial variation in the Relative Operating Characteristics (ROC) skill ...
Interval/period: N/A
The ECMWF seasonal forecasts (SEAS5) are produced every month with a 51-member ensemble at a ...
Interval/period: N/A

This chart shows the spatial variation in the Anomaly Correlation Coefficient (ACC) for the ...
Interval/period: N/A
Interval/period: Sun, 01/01/1978 - Wed, 10/17/2018
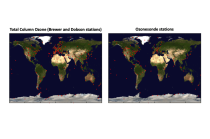
The total ozone estimates are based on solar UV radiation measurements made by ground-based spectrophotometers (Dobson or Brewer type spectrophotometers).
The vertical profiles of ozone concentration are estimated primarily using ozonesonde observations.
Data are available for 159 Dobson stations, 109 Brewer stations and 135 ozonesondes stations.
Interval/period: Tue, 01/01/1924 - Sat, 05/09/2026
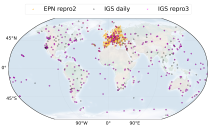
(GNSS) radio signals.
The initial data is collected from two in situ ground-based network of GNSS receivers – the International GNSS Service
(IGS) and EUREF Permanent Network (EPN). The IGS collects, archives, and freely distributes GNSS data from a
cooperatively operated global network of more than 500 ground-based GNSS stations since 1994. The EPN is a European
Interval/period: Mon, 01/01/1996 - Sat, 05/09/2026
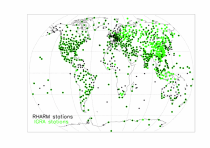
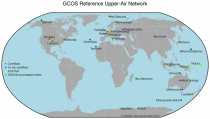
The first is version 2 of the Integrated Global Radiosounding Archive (IGRA) from 1978 which incorporates global
radiosounding profiles of temperature, humidity and wind from a large number of data sources,
which is 30% larger than the previous version 1. IGRA v2 is the result of quality assurance procedures applied to the
Interval/period: Sun, 01/01/1978 - Sat, 05/09/2026
Detailed information on these EXPERIMENTAL products can be found
Interval/period: N/A
Detailed information on these EXPERIMENTAL products can be found
Interval/period: N/A