Datasets
Dew Point Temperature at 2 m above the earth’s surface gives an indication of conditions which a person will experience or feel. High dewpoint temperatures inhibit heat loss from the body by perspriation and...
Interval/period: N/A
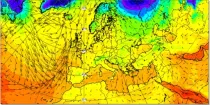
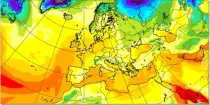
Temperatures at 2 m above the earth’s surface and winds at 10 m above the earth’s surface approximate most closely to the conditions that a person would experience.
Interval/period: N/A
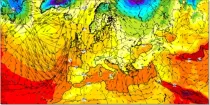
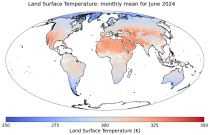
Air temperatures at 2 m above the earth's surface approximate most closely to the conditions a person would most likely experience...
Interval/period: N/A
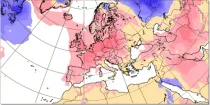
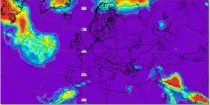
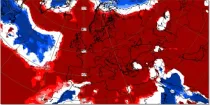
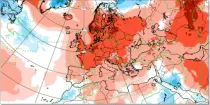
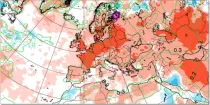
This chart shows the anomaly in the temperature at 2 m above the earth’s surface (in °C) during a 24 hour period immediately preceding the chosen valid date/time...
Interval/period: N/A
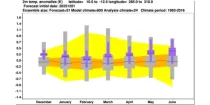
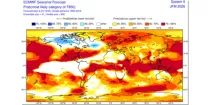
This chart shows probabilities for the 7-day mean anomalies of 2 m air temperature to be in ...
Interval/period: N/A
This chart shows probabilities that 7-day mean 2 m air temperatures (from the 101 forecast ...
Interval/period: N/A
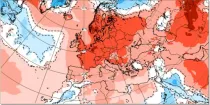
This chart shows 7-day mean anomalies of 2m air temperature from the ECMWF Sub-seasonal range ...
Interval/period: N/A
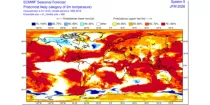
The ECMWF seasonal forecasts (SEAS5) are produced every month with a 51-member ensemble at ...
Interval/period: N/A
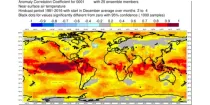
This chart shows the spatial variation in the Anomaly Correlation Coefficient (ACC) for the ...
Interval/period: N/A
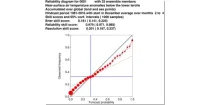
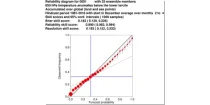
The reliability diagram shows the reliability of the ECMWF seasonal forecast system (SEAS5) with ...
Interval/period: N/A
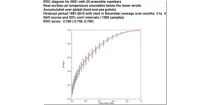
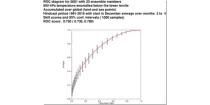
This chart shows the Relative Operating Characteristics (ROC) diagram for the three-month ...
Interval/period: N/A
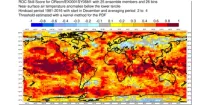
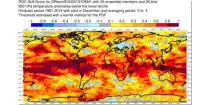
This chart shows the spatial variation in the Relative Operating Characteristics (ROC) skill ...
Interval/period: N/A
The ECMWF seasonal forecasts (SEAS5) are produced every month with a 51-member ensemble at a ...
Interval/period: N/A

The 850 hPa level is usually just above the boundary layer and at this level the day-night variation in temperature is generally negligible...
Interval/period: N/A
The reliability diagram shows the reliability of the ECMWF seasonal forecast system (SEAS5) with ...
Interval/period: N/A
This chart shows the Relative Operating Characteristics (ROC) diagram for the three-month ...
Interval/period: N/A
This chart shows the spatial variation in the Relative Operating Characteristics (ROC) skill ...
Interval/period: N/A
The ECMWF seasonal forecasts (SEAS5) are produced every month with a 51-member ensemble at a ...
Interval/period: N/A

This chart shows the spatial variation in the Anomaly Correlation Coefficient (ACC) for the ...
Interval/period: N/A
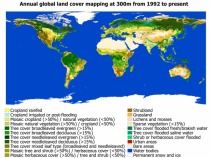
Interval/period: Wed, 01/01/1992 - Sat, 01/01/2022
Interval/period: Thu, 06/01/1995 - Tue, 12/31/2024
Detailed information on these EXPERIMENTAL products can be found
Interval/period: N/A
Detailed information on these EXPERIMENTAL products can be found
Interval/period: N/A

Various thermall comfort parameters showing thermal comfort
Interval/period: N/A
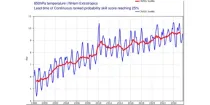
This diagram gives a measure of the effectiveness of the model by showing how far ahead in the ...
Interval/period: N/A