Datasets

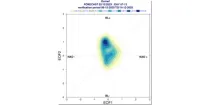
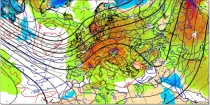
This chart shows 7-day mean anomalies of 500hPa geopotential height from the ECMWF Sub-seasonal ...
Interval/period: N/A
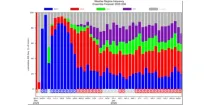
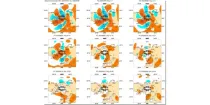
These diagrams show the evolution of regimes indicative of likely weather by week around ...
Interval/period: N/A
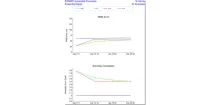
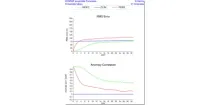
This diagram shows daily probabilities for four types of Euro-Atlantic weather regimes over ...
Interval/period: N/A
**Note:** In **June 2023** ECMWF implemented a **major upgrade ...**
Interval/period: N/A
**Note:** In **June 2023** ECMWF implemented a **major upgrade ...**
Interval/period: N/A
This chart shows 7-day mean anomalies for a range of parameters from the ECMWF Sub-seasonal ...
Interval/period: N/A
**Note:** In **June 2023** ECMWF implemented a **major upgrade ...**
Interval/period: N/A
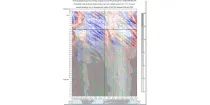
This is a time/longitude diagram (Hovmoller diagram) of 500 hPa or 1000 hPa mean height anomaly ...
Interval/period: N/A