Datasets
This chart shows 7-day mean anomalies of temperature at 10hPa from the ECMWF Sub-seasonal range ...
Interval/period: N/A

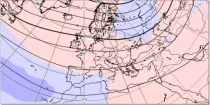
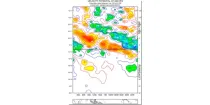
This chart shows 7-day mean anomalies of 500hPa geopotential height from the ECMWF Sub-seasonal ...
Interval/period: N/A

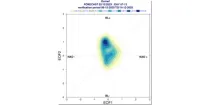
This diagram shows time evolution of a Madden-Julian Oscillation (MJO) index. ...
Interval/period: N/A
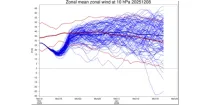
This shows the daily distribution and evolution of mean zonal wind at 10hPa at 60N or 60S. ...
Interval/period: N/A
These diagrams show the evolution of regimes indicative of likely weather by week around ...
Interval/period: N/A
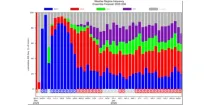
This diagram shows daily probabilities for four types of Euro-Atlantic weather regimes over ...
Interval/period: N/A
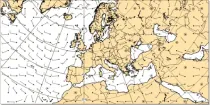
This chart shows 7-day mean anomalies of wind speed and direction from the ECMWF Sub-seasonal ...
Interval/period: N/A

The charts show mean frequency and accumulated cyclone energy of tropical storm activity. ...
Interval/period: N/A

The charts show the evolution of existing and potential tropical cyclone activity. ...
Interval/period: N/A
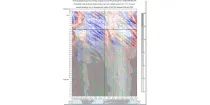
This is a time/longitude diagram (Hovmoller diagram) of 500 hPa or 1000 hPa mean height anomaly ...
Interval/period: N/A
The time-longitude diagram (Hovmoller diagram) shows a section of ensemble mean anomalies or ...
Interval/period: N/A