Datasets

A meso-scale ensemble system focusing on short range probabilistic forecasts and profiting from advanced multi-scale ALARO physics. Its main purpose is to provide probabilistic forecast on daily basis for the national weather services of RC LACE partners. It also serves as a reliable source of probabilistic information applied to downstream hydrology and energy industry.
Interval/period: N/A
It is the Limited-area Ensemble Prediction System (LEPS), based on COSMO-model and implemented within COSMO (COnsortium for Small-scale Modelling, including Germany, Greece, Israel, Italy, Poland, Romania, Russia, Switzerland) implemented and maintained by Arpae-SIMC.
Interval/period: N/A

Single-member eddy-permitting reforecasts based on the IFS cycle 48r1 atmosphere run at Tco319 combined with the eORCA025 NEMO4-SI3 ocean and sea ice configurations. Forecasts consists of a single unperturbed member run for 32 days starting on the first of each month between 1995 and 2016, for a total of 264 start dates. Atmospheric fields are initialised from the the GLORYS12v1 eddy-rich global ocean reanalysis.
Examples
Interval/period: N/A
Single-member eddy-rich reforecasts based on the IFS cycle 48r1 atmosphere run at Tco319 combined with the eORCA12 NEMO4-SI3 ocean and sea ice configurations. Forecasts consists of a single unperturbed member run for 32 days starting on the first of each month between 1995 and 2016, for a total of 264 start dates. Atmospheric fields are initialised from the the GLORYS12v1 eddy-rich global ocean reanalysis.
Examples
Interval/period: N/A
Updated 2025-11-04. A 10+1 member coupled IFS (cycle 47R3) extended-range reforecast experiment covering the period 1959-2023 with forecasts initialized on the 1st, 8th, 15th, and 22nd, of each month. The atmosphere is configured with 137 vertical levels and uses the Tco199 cubic octahedral reduced Gaussian grid. The IFS is coupled hourly to the 75 level version of the NEMO v3.4 ocean model and the LIM2 sea-ice model, both of which use the ORCA1 tripolar grid. Coupling follows the implementation used in ECMWF CY47R3 operational reforecasts.
Interval/period: N/A
101-member coupled IFS (cycle 47R3) subseasonal reforecasts covering the period 2001-2020 with forecasts initialized on February 1st, May 1st, August 1st, and November 1st. The atmosphere is configured with 137 vertical levels and uses the Tco199 cubic octahedral reduced Gaussian grid. The IFS is coupled hourly to the 75 level version of the NEMO v3.4 ocean model and the LIM2 sea-ice model, both of which use the ORCA1 tripolar grid. Coupling follows the implementation used in ECMWF CY47R3 operational reforecasts.
Interval/period: N/A
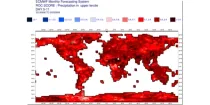
This data set contains net fluxes at the surface, atmospheric mixing ratios at model levels, for carbon dioxide (CO2), methane (CH4) and nitrous oxide (N20).
Interval/period: N/A
ECMWF is now running a series of data-driven forecasts as part of its experimental suite. These machine-learning based models are very fast, and they produce a 10-day forecast with 6-hourly time steps in approximately one minute. The outputs are available in graphical form.
Currently, three of these models are available:
Interval/period: N/A

This diagram shows time evolution of a Madden-Julian Oscillation (MJO) index. ...
Interval/period: N/A
**Note:** In **June 2023** ECMWF implemented a **major upgrade ...**
Interval/period: N/A
Maximum Wind gusts at 10 m above the earth's surface during the 6 hour period previous to the selected validity time are shown using colour shading. 10 m wind gusts are a post-processed product...
Interval/period: N/A
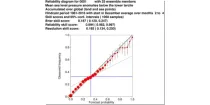
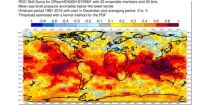
The reliability diagram shows the reliability of the ECMWF seasonal forecast system (SEAS5) with ...
Interval/period: N/A
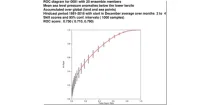
This chart shows the Relative Operating Characteristics (ROC) diagram for the three-month ...
Interval/period: N/A
This chart shows the spatial variation in the Relative Operating Characteristics (ROC) skill ...
Interval/period: N/A
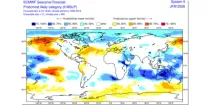
The ECMWF seasonal forecasts (SEAS5) are produced every month with a 51-member ensemble at a ...
Interval/period: N/A
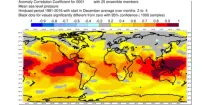
This chart shows the spatial variation in the Anomaly Correlation Coefficient (ACC) for the ...
Interval/period: N/A
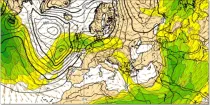
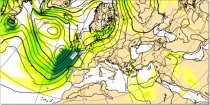
Wind speed at 200 hPa highlights the jet stream (areas of strong winds in the upper troposphere) which can help identify movement and development of depressions...
Interval/period: N/A
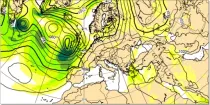
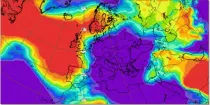
Wind speeds near the surface are roughly proportional to the distance between isobars so closely packed isobars mean strong surface winds...
Interval/period: N/A
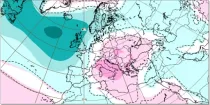
This chart shows probabilities for the 7-day mean anomalies of mean sea level pressure (mslp) to ...
Interval/period: N/A
This chart shows probabilities that the 7-day mean of mean sea level pressure (from the 101 ...
Interval/period: N/A
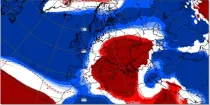
This chart shows 7-day mean anomalies of mean sea level pressure (mslp) from the ECMWF ...
Interval/period: N/A

Mean wave period is the spectrally averaged period of the waves. Wave periods are shown in seconds using colour shading – click on the middle icon to the bottom right for the scale...
Interval/period: N/A
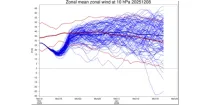
This shows the daily distribution and evolution of mean zonal wind at 10hPa at 60N or 60S. ...
Interval/period: N/A
Each country's experiments can be accessed via the links below:
Interval/period: N/A
SNAPSI case study of Northern Hemisphere strong polar vortex case in the stratosphere, initialised on 2022-01-01. TCo319L137 resolution 51-member ensemble, integrated for 70 days. Nudging to the zonal-mean.
Examples
Interval/period: N/A