Datasets

A subset of ECMWF real-time forecast data from the IFS and AIFS models is made available to the public free of charge. Their use is governed by the Creative Commons CC-BY-4.0 licence and the ECMWF Terms of Use.
Interval/period: N/A
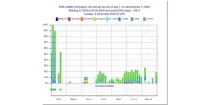
**This product shows ENS meteograms from next model version of IFS cycle 50R1 that is planned ...**
Interval/period: N/A
**Next IFS version (cycle 50r1)**. This product shows the probability of visibility (%) in 2 ...
Interval/period: N/A
(Next IFS version - CY50R1) Probability of precipitation type (%) in precipitation rate categories ...
Interval/period: N/A
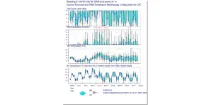
(New IFS cycle 50R1) The Vertical Profiles display the vertical structure of the forecast model atmosphere in a familiar user friendly way. The vertical structure of temperatures (red) dewpoints (green) and dewpoint depressions (blue) from each ENS member ...
Interval/period: N/A
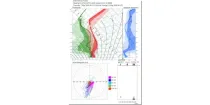
Bulk Wind Shearcharts show the vector value (in wind arrow form) of the shear between the low level, near surface level (10 m) and a mid-tropospheric level (about 6 km)...
Interval/period: N/A
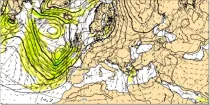
The surface wind is influenced by the roughness of the earth's surface and is likely to be less strong, and a little backed (in the northern hemisphere) or veered (in the southern hemisphere)...
Interval/period: N/A
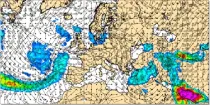
This chart shows the anomaly in the wind speed at 10 m above the earth's surface (in m/s) ...
Interval/period: N/A
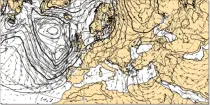
These charts show surface pressure patterns. Areas of high pressure (anticyclones) are usually associated with settled weather...
Interval/period: N/A
Dew Point Temperature at 2 m above the earth’s surface gives an indication of conditions which a person will experience or feel. High dewpoint temperatures inhibit heat loss from the body by perspriation and...
Interval/period: N/A
Temperatures at 2 m above the earth’s surface and winds at 10 m above the earth’s surface approximate most closely to the conditions that a person would experience.
Interval/period: N/A
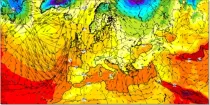
Air temperatures at 2 m above the earth's surface approximate most closely to the conditions a person would most likely experience...
Interval/period: N/A
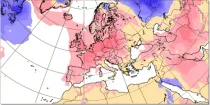
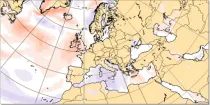
This chart shows the anomaly in the temperature at 2 m above the earth’s surface (in °C) during a 24 hour period immediately preceding the chosen valid date/time...
Interval/period: N/A

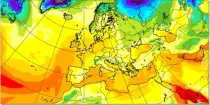
The 850 hPa level is usually just above the boundary layer and at this level the day-night variation in temperature is generally negligible...
Interval/period: N/A

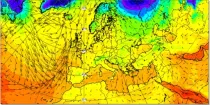
500-1000 hPa thickness is a measure of the mean temperature of a column of the atmosphere between these pressure levels and can be used to distinguish between warm and cold air masses and...
Interval/period: N/A

These charts show indices which indicate the susceptibility of the troposphere to support free convection. Typical values of the different indices depend on location and...
Interval/period: N/A

Interval/period: N/A
Interval/period: N/A
Interval/period: N/A
Interval/period: N/A
Interval/period: N/A
Single prediction that uses
observations prior information about the Earth-system ECMWF's highest-resolution modelHRES Direct model output Products offers "High Frequency products"
4 forecast runs per day (00/06/12/18) (see dissemination schedule for details) Hourly steps to step 90 for all four runs.Not all post-processed Products are available at 06/18 runs or in hourly steps.
Interval/period: N/A

Various thermall comfort parameters showing thermal comfort
Interval/period: N/A
This product is derived from an ensemble of 50 model runs plus Control. Visibility is an ...
Interval/period: N/A

Simulated visible images show simulations of the upward flux of radiation (as would be detected by a weather satellite) derived from information using the model representation of temperatures and cloud layers.
Interval/period: N/A